Manchester United’s 2019 Finances – Ole at the Wheel

Manchester United's 2019 Finances

Manchester endured a turbulent 18/19 season as they struggle to return to the successes of the Ferguson years. 

Following a much publicised poor start to the campaign, Jose Mourinho was sacked and replaced with club legend Ole Gunnar Solskjær, sparking an incredible run of form that saw the club appoint him full time manager.

However, form dipped following this and Manchester United laboured to a sixth placed Premier League finish and no Champions League football next year following their quarter final exit.

There was no further joy in the domestic cups with exits in both by the quarter final stage. 

This didn’t stop the club posting record revenues as one of the world’s biggest clubs continue to perform off the pitch.

Let’s delve into the numbers.

Manchester United Profit:Loss 2019

Revenue Analysis

Manchester United Revenue 2019

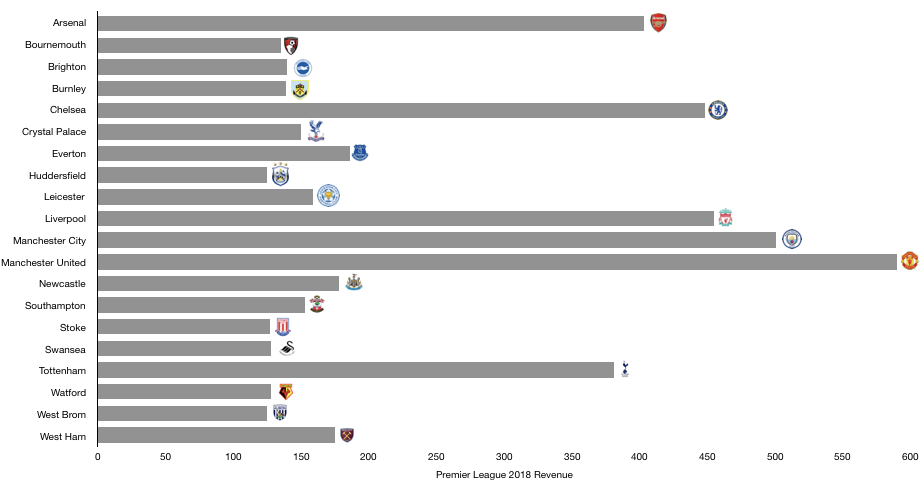
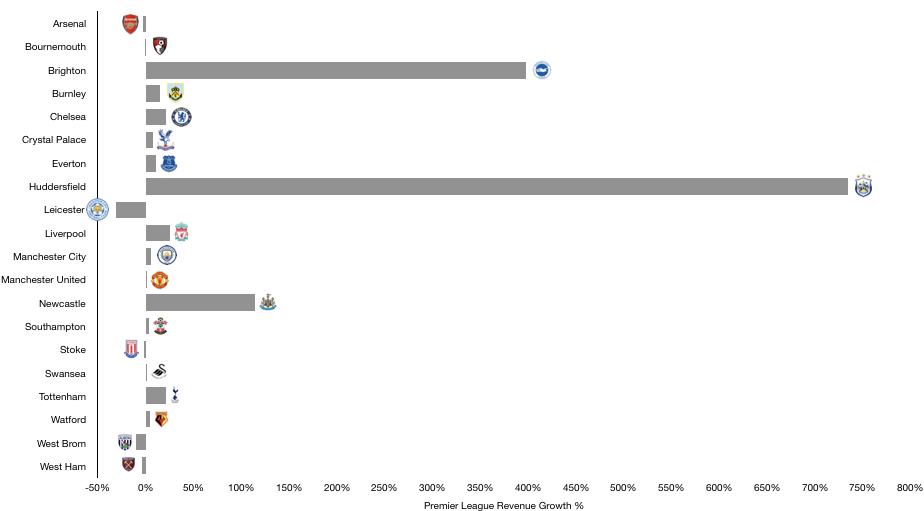
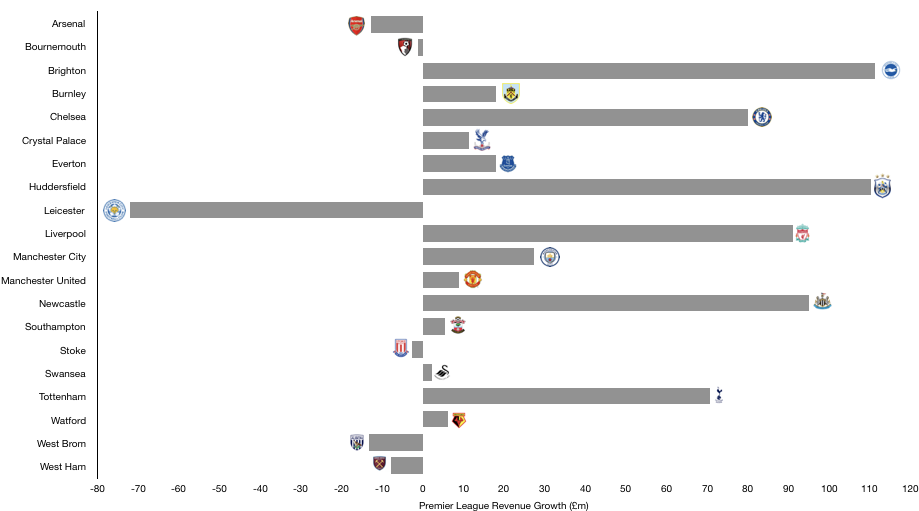
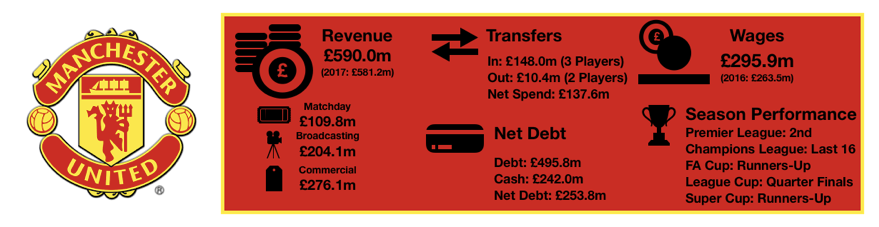
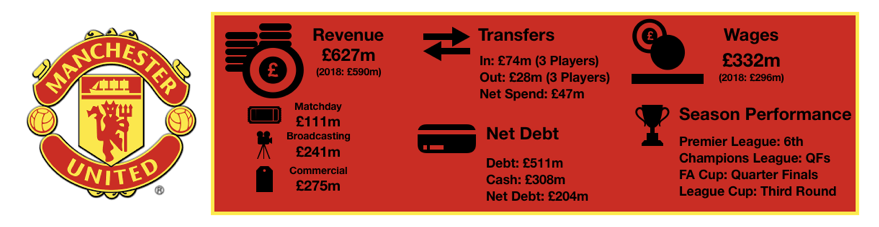
Despite a disappointing campaign on the pitch, a return to the Champions League saw Manchester United’s revenue reach record levels, rising from £590m to £627m (6%).

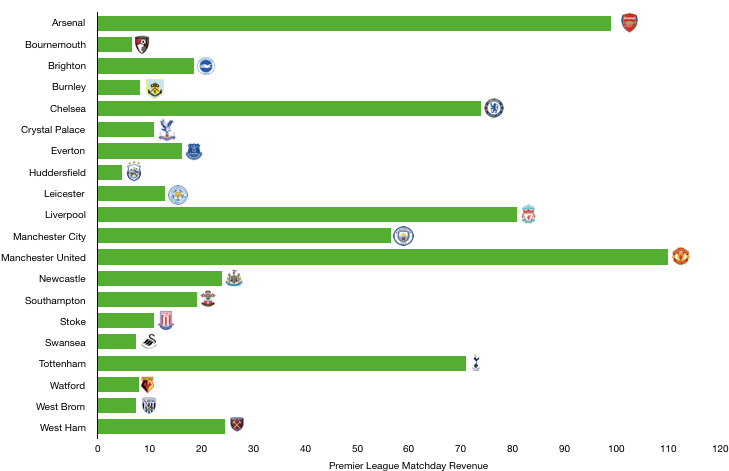
Matchday revenue remained relatively stable, increasing from £110m to £111m (1%). This rise was largely due to competing in the Champions League and the more expensive ticket prices of the competition over the Europa League.

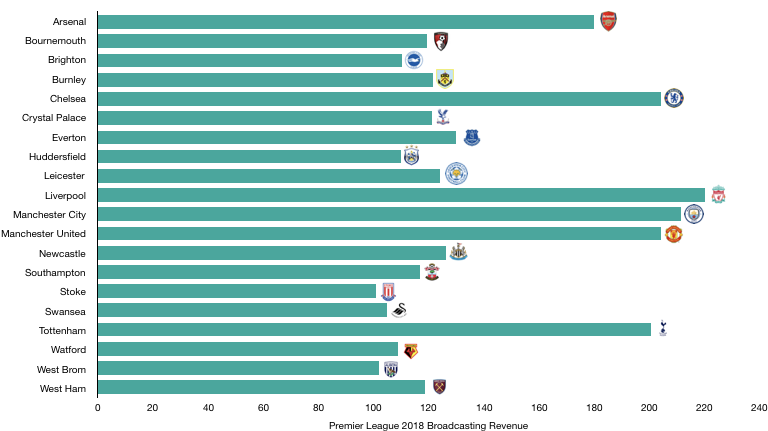
Broadcasting revenue was up significantly, rising from £204m to £241m (18%), mainly due to a return to the Champions League and UEFA’s new licensing agreement. This offset the £7m revenue loss Manchester United suffered by finishing 4 places lower in the Premier League.

Commercial revenue was pretty much stable, falling from £276m to £275m (0.4%). Sponsorship revenue remained the same as Manchester United reach what may be a critical mass in sponsors until their next deal cycle. Interestingly, the fall in revenue was down to a decline in merchandise and retail sales, which fell to £102m.

Looking ahead, Manchester United are likely to see a drop in revenue after they failed to qualify for the Champions League. With a title winning campaign unlikely, there is no other way for the club to bridge the loss revenue from the lack of a Champions League campaign except strong commercial growth. 

Such growth commercially has not occurred in the last 3 years and this will need to change to protect revenue from falling.

Costs Analysis

Manchester United Costs 2019

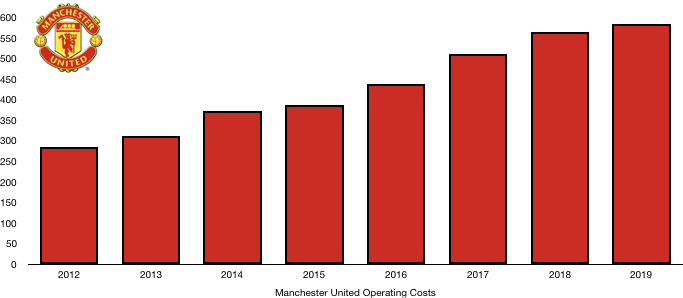
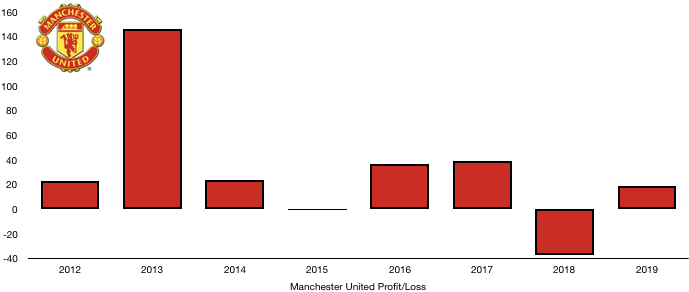
Manchester United saw a modest rise in costs given the rise in revenue in 18/19, with costs rising from £564m to £583m (3%). This 3% rise is half the rise in revenue (6%), which has saw Manchester United’s profitability improve last season.

Amortisation fell from £138m to £129m (7%) on the back of a relatively quiet season by Manchester United standards, with their smallest net transfer spend since 2012 (see transfer analysis section).

Net interest costs increased from £18m to £23m (27%), this was largely due to the strengthening of the dollar against the pound, showing the effects Brexit and other macro-economic factors can have on a football club.

Manchester United Wages 2019

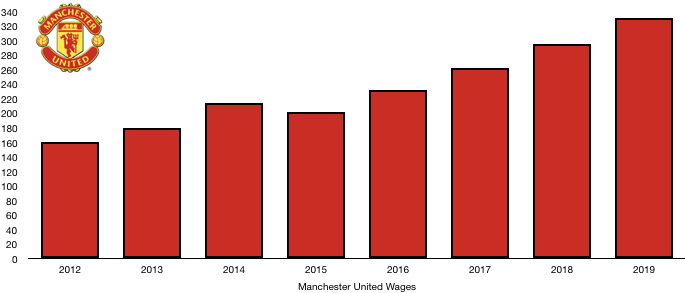
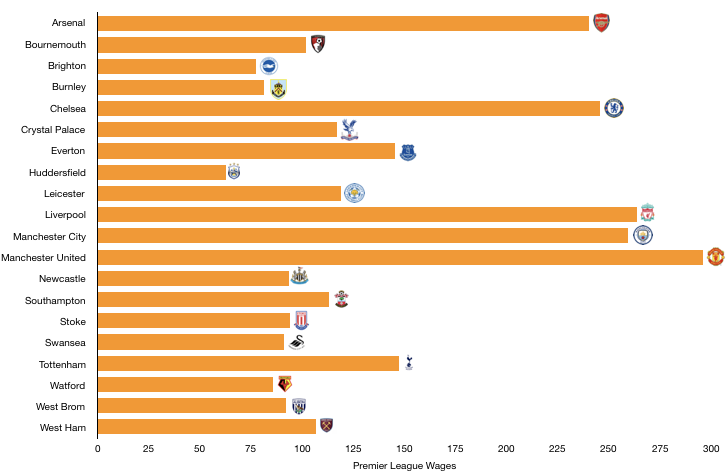
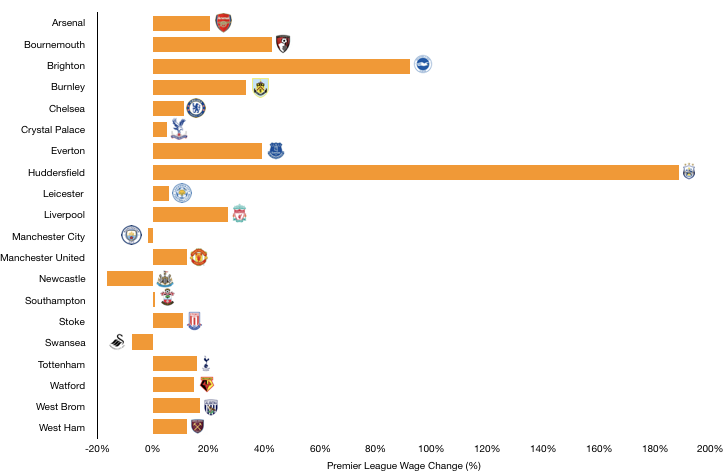
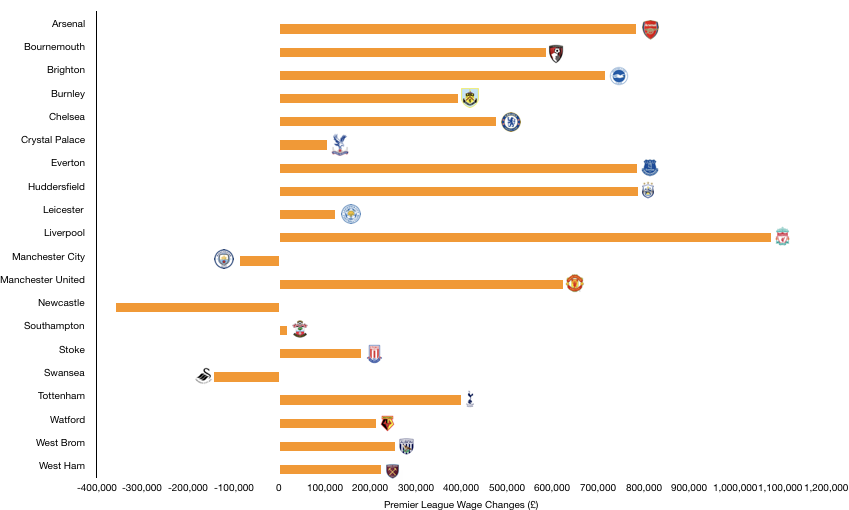
Manchester United saw wages rise significantly despite a quiet transfer season, increasing from £296m to £332m (12%). This was largely due to contract renewals (Shaw, Smalling, Jones) as well as new signings that entered plus a full season of Alexis Sanchez’s much publicised wages.

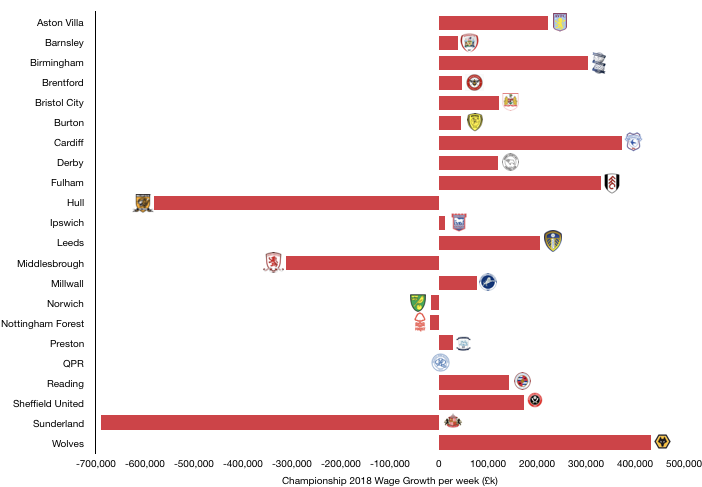
This increase in wages works out as an extra £692k a week and interestingly, wages also increased by 12% last year, showing an increasing trend in wage growth in football.

Further to their staff costs, Manchester United shelled out £20m in compensation to Jose Mourinho following his sacking. Such costs are one-offs and will not occur this season (Ole is reportedly on much lower wages and contract term than Mourinho was) and should go some way to offsetting the fall in revenue expected from no Champions League.

Other costs fell from £117m to £108m (8%), largely due to the World Cup which meant a shorter preseason tour and there was also a reduction in domestic cup costs.

Looking ahead, Manchester United are likely to see a similar level of costs next year. The lack of severance pay next year as noted will see an immediate £20m reduction in costs. This plus the exit of high earners such as Herrera, Lukaku and Valencia (most of Sanchez’s wages are still being paid by Manchester United), should more than cover the increase in wages from their latest signings.

Transfers Analysis 

Manchester United Net Transfer Spend 2019

Manchester United saw three players join and three leave for transfer fees in 18/19.

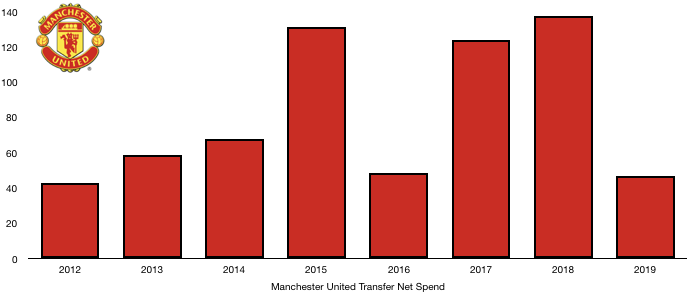
In came Fred (£53m), Dalot (£20m) and Grant £2m for a combined £75m. Out went Blind (£14m), Johnstone (£7m) and Fellaini (£7m) for a combined £28m, leading to a net spend of £48m, down 66% of last year’s net spend of £138m.

The big new signing Fred struggled to get into side and has disappointed fans with his performances. Dalot impressed in spells and clearly has potential.

None of the departed players were particularly missed, however with things proving difficult for Mourinho and co, the new signings Fred and Dalot were clearly not enough to keep Manchester United challenging.

The sales of Fellaini, Blind and Johnstone led to Manchester United recording a profit on player sales of £26m which was £8m up from the prior season and helped the club record a profit.

In cash terms, Manchester United spent £178m on players in 18/19, primarily due to instalments due from previous signings.

In contrast Manchester United received £43m, leading to a net cash outflow of £135m, explaining partly why last summer was a lighter year transfer wise for the club.

Manchester United are owed £18m in transfer fees, of which £10m is due this year.

However, Manchester owe a huge £188m, of which £111m is due this year.

This means that net, Manchester United owe clubs £170m, of which £101m is due this year, further showing why the club didn’t back Mourinho last summer with more signings.

In contingent transfer fees, Manchester United could also pay a maximum of £74m should certain clauses in player contracts be met, although it is unlikely this full amount will ever become payable.

Debt Analysis

Manchester United Net Debt 2019

Manchester United are notoriously run via debt however this has been a model that has worked for the club ever since the Glazers took over.

On the cash side, Manchester United are at their most cash rich point ever after cash reserves rose from £242m to £308m (27%). This was primarily due to an improvement in cash from operations and an increase in revenue.

On the other side, debt levels also increased to new highs, rising from £496m to £511m (3%), this £15m increase is primarily due to changes in the exchange rate as the dollar strengthens/pound weakens.

Overall, this means Manchester United’s net debt has fallen from £254m to £204m (20%). This will please fans who feel the club should be becoming more sustainable and will also lessen any Financial Fair Play concerns UEFA or other parties have.

Looking ahead, it is clear Manchester United have a rebuilding job on their hand which may take some time. However, the key financially is to remain in the Champions League, something they have failed to do. 

Commercial revenue and matchday revenue will remain robust, so the shortfall is likely to only be due to performances on the pitch which can only be improved by better management and/or players which is easier said than done.

Thanks for reading! Share with a Manchester United fan.

Please follow and like us:
error

Hull City’s 2019 Finances – Parachute Profits

Hull City FC's 2019 Finances

Hull endured a second successive season in the Championship following relegation from the Premier League in 2017.

It was an underwhelming season once again for the Tigers, who finished mid table in 13th, improving on the previous season’s 18thplaced finish.

A poor end to the season for Nigel Adkins’ side spelled the end of a late play-off push, something the club will be hoping to amend in the coming season under new boss Grant McCann.

Financially, Hull remain one of the few profitable Championship clubs due to the benefit of parachute payments following relegation and a number of player sales in the 2018 season. Despite the financial boost these gave, their reduction and the lack of player sales in 2019 have seen Hull’s profit after tax fall from £19m to £3m (84%), showing a significant downward trend in profits.

Let’s delve into the numbers.

Hull City Profit:Loss 2019

Revenue Analysis

Hull City 2019 Revenue

Despite an improved domestic campaign, Hull saw underlying revenue (excluding payments) fall from £12.3m to £11.2m (9%). When taking into account parachute payments the drop is far greater, falling from £55m to £48m (13%).

This was primarily due to a fall in match day revenue of £1m from £7.2m to £6.2m (14%) as average attendances fell from 15,622 to 12,165 (22%) as fan goodwill faded following a poor season. Hull also benefited in 2018 from a run to the FA Cup Fifth Round, featuring a lucrative trip to Stamford Bridge.

Broadcasting revenue increased, rising from £2.3m to £2.7m (17%) after Hull finished 5 places higher in the Championship last season. This is despite exiting the FA Cup at an earlier stage.

Parachute payments began to taper off following a prolonged stay in the Championship, falling from £43m to £37m (14%). These parachute payments will continue to decline over the next two seasons before ceasing, meaning Hull may have to prioritise a return to the Premier League or face worsening finances.

Hull suffered from a second successive season in the Championship commercially, with commercial revenue falling from £2.8m to £2.2m (21%). Should Hull fail once again to gain promotion (or challenge), commercial revenue may fall below £2m.

Looking ahead, revenue is very likely to fall in the 19/20 season due to another drop in parachute payments. Even if promotion is secured, in the short run (next year), Premier League income would lag a season behind the fall in parachute payments and therefore revenue is likely to deteriorate further.

Costs Analysis

Hull City costs 2019

Hull have undergone cost control in order to safeguard their finances, with revenue falling year on year following relegation. Total costs fell from £60m to £49m (18%), a greater fall than revenue, improving underlying profitability.

Amortisation remained relatively stable, increasing from £12.3m to £13.0m (6%) after minimal player investment (just over £2m was spent in the season – see transfers analysis section).

Interest costs fell from £3.1m to £2.4m (23%) after a decrease in the debt owed by the club (see debt analysis section).

Hull City Wages 2019

In a bid to remain profitable, Hull adopted strict wage controls to reduce their wage bill. Wages fell from £31m to £25m (19%), greater than the fall in revenue (13%), essentially improving underlying profitability despite the figures not showing such.

A host of high-earners such as Meyler, Larsson and Hernandez were released, freeing up wages for new signings while also reducing the overall wage bill.

Hull were also taxed £424k, an effective tax rate of 14%, below the actual tax rate of 19%.

Looking ahead, Hull were fairly inactive in the 2019 summer transfer window and as such wages and amortisation (two of the largest costs) are likely to remain fairly stable, with a slight increase being expected to overall costs.

Transfers Analysis

Hull City Net Transfer Spend 2019

Hull saw a significant pool of players depart on free transfers in 2018/19 with little in the way of transfer fees with no departures (for fees) and only 3 signings (for fees).

In came Burke (£1.5m), De Wijs (£0.4m) and Milinkovic (£0.3m) for a combined £2.2m.

The signings all performed as expected with none really disappointing in their first season with the onus now being on them to kick on.

The lack of player sales compared to the exodus following relegation helped stabilise the team on the pitch and it showed. However, without such sales, Hull saw their profit on player sales fall from £31m to £5m (83%). (Despite no player sales in 2018/19, contingent transfer fees would’ve have been activated hence the £5m profit).

In cash terms, Hull spent £1.9m on new players and received £4.6m, a net cash inflow of £2.7m.

Hull are also owed £5.5m in transfer fees, although this is significantly down on last year’s £20m (which has boosted cash reserves – see debt analysis).

However, Hull do themselves owe £2.5m in transfer fees in the next year, which is more than covered by the amounts owed to them so shouldn’t be a financial worry.

In terms of contingent fees, Hull could be liable to make payments of £6.6m depending on palter appearances etc. Fortunately, Hull could also be due £7.3m should players previously sold meet certain clauses.

Debt Analysis

Hull City Net Debt 2019

Hull are fairly cash-rich compared to their peers, with cash reserves increasing from £3m to £10m (233%) in their second Championship season. This was due to their ability to reduce costs by more than the fall in revenue and also due to the net transfer income they received.

This allowed Hull to repay £13m in loans, ensuring the club are more sustainable going forward.

As mentioned above, Hull have begun attempting to reduce the debt owed by the club to their owner, Mr Allam. Debt fell from £63m to £50m (21%) after the repayment mentioned above, which also reduced interest costs.

Hence net debt has fallen from £60m to £40m (33%).

Going forward, Hull will need to be careful to manage the balance between their ambitions and finances to ensure compliance with Financial Fair Play in a period where many EFL clubs are at risk of falling foul of the measures.

Hull have prudently managed their finances since relegation, recording profits in both periods, although this will become increasingly difficult as parachute payments fall and unless the club make any significant player sales. However, due to profits of £22m over the past two years, Hull should be fairly secure from any FFP troubles for the next couple of seasons at least, plenty of time to attempt to secure promotion back to the Premier League.

Thanks for reading – Please Share!

Please follow and like us:
error

Championship 2018 Finances – Revenue

Championship 2018 Finances - Revenue

2018 was another unpredictable season in the Championship with Wolves’ mega spending seeing them clinch promotion and the title. However, Cardiff were the surprise package, sealing the other automatic promotion spot while Fulham went up via the play-offs.

At the bottom of the table it was misery for Sunderland who were condemned to back-to-back relegations alongside Barnsley and Burton to League One.

However, this article is about finances, and more specifically revenue and which clubs are bringing in the cash and who is in desperate need of some.

Revenue actually fell from £893m to just £701m (22%), primarily due to the relegated clubs who saw their revenue drop by a combined painful £181m! Excluding these clubs from the analysis leads to only a 2% drop in revenue which is still a concern.

This is fall is largely driven by falls in broadcasting revenue as due to poor cup campaigns for many clubs and also a general fall in the commercial appeal of clubs in England’s second division which has only widened the Chasm between the Premier League and Championship.

To compare, Premier League clubs earned nearly 7 times as much as Championship clubs in 2018, showcasing why Championship clubs have been going for broke with unsustainably high wages as of late, gambling on reaching the big time and big bucks.

The average revenue of a Championship clubs is only £32m compared to roughly £240m among Premier League clubs! This average falls to a measly £27m when excluding the relegated clubs who benefit significantly from parachute payments following their relegations.

Please note that Bolton are yet to release their finances due to their ongoing financial troubles while Sheffield Wednesday have so far yet to file their accounts which are long overdue.

Championship 2018 Revenue

Revenue Rumbled

Championship 2018 Revenue Growth %

As mentioned, Championship revenue fell by 22% to £701m due to the drop in revenue of the relegated clubs. This drop does fall to 2% when excluding those clubs however still points to a revenue slow down which will be a concern to many Championship clubs and their owners who are leaking money due to high wages.

Let’s start with those relegated clubs, Hull (£56m), Middlesbrough (£62m) and Sunderland (£63m) saw their revenue fall by 52%, 49% and 49% respectively following relegation, losing out on incredible £181m in the process, showing the huge immediate costs of relegation.

And this isn’t even the end of it, parachute payments will continue to fall, further hurting revenue unless a quick return to the Premier League is secured.

Other big revenue losers were Reading (£18m), QPR (£31m) and Norwich (£62m) who all saw heavy reductions in the above mentioned parachute payments, leading to drops in revenue of 51%, 35% and 18% respectively.

On the end of the scale were Sheffield United (£20m), Millwall (£16m), Bristol City (£26m) and Cardiff (£33m) for all too different reasons. 

Sheffield United and Millwall benefitted from promotion back to the Championship which helped them revive their dwindling commercial appeal after both secured top half finishes, increasing their revenue by 75% and 56% respectively.

Championship 2018 Revenue Growth £m

Bristol City saw a sharp uptake in revenue of 23% due to a remarkable run to the EFL cup semi finals that significantly boosted revenue after a giant-killing win over Manchester United caught everyone’s attention.

Lastly Cardiff saw a 21% boost in revenue after securing promotion. This increase however pales in comparison with the riches they will gain from promotion despite an immediate return to the Championship.

Outside of this, Leeds (£41m), Fulham (£38m) and Wolves (£26m) all experienced double digit growth as they began returning to prominence. Likewise, Burton (£13m) and Barnsley (£14m) also experienced double-digit growth from their lowly revenue figures.

Aston Villa (£69m) on the other hand saw revenue fall by 7% after another season in the Championship. This will fall further in 2019 following a drop in parachute payments, however a timely promotion has saved the day.

Matchday Money

Championship 2018 Matchday Revenue

Championship clubs saw a 4% drop in matchday revenue to £143m after poorer cup runs by the majority and a fall in fan appetite that saw attendances fall and spending on matchdays decrease.

Matchday revenue is largely driven by attendances and stadium capacity so its no surprise that the biggest earners are Leeds (£17m), Aston Villa (£12m), Norwich (£10m), Derby (£9m) and Sheffield United (£9m) who all have stadiums with capacity exceeding 27,000.

On the other end of the scale are Burton (£2m), Brentford (£3m), Barnsley (£4m) and Reading (£4m), who all have stadia with capacity below 24,000. Burton (6,200) and Barnsley (12,763) are significantly constrained by their stadium size. However, worryingly for Brentford and Reading, their stadiums exceed 20,000 and therefore shows a lack of fans at their games.

Matchday revenue accounts for 21% of revenue for Championship clubs and is a relatively stable income stream with attendances not varying much year on year. However, fan engagement is lessening with fewer fans attending games due to a lack of enjoyment and/or more games on TV.

Championship clubs going forward are going to struggle to attract fans and meaningful matchday takings due to many younger fans opting for Premier League top sides even where this isn’t their local team unless something is done to prevent this soon.

EFL Earnings

Championship 2018 Broadcasting Revenue

Broadcasting revenue makes up 57% of Championship club (falling to 49% without Premier League relegated clubs), making it their most importance form of revenue. Championship clubs gain this revenue from the EFL for Championship and League Cup performances and also receive cash from the FA Cup.

Not taking into accounted those relegated clubs, broadcasting revenue fell by 11% as parachute payments fell for those clubs relegated within the last 3 years, while Championship clubs faltered in the cups.

Unsurprisingly the three relegated clubs Hull (£46m), Middlesbrough (£47m) and Sunderland (£48m) had the highest levels of revenue due to significant parachute payments. Despite this, their revenue dropped by 51%, 54% and 49% respectively, showing the huge costs of relegation.

More positively, Barnsley (£8m), Bristol City (£8m), Millwall (£8m), Nottingham Forest (£9m) and Sheffield United (£8m) all experienced double digit growth in revenue, with Sheffield United seeing a 406% growth in revenue following promotion!

Burton would have also experienced significant growth in broadcasting revenue, however they have combined both broadcasting and commercial revenue together (£11m) so cannot be analysed.

Aston Villa (£40m), Norwich (£40m), QPR (£20m) and Reading (£8m) all experienced big falls in broadcasting revenue after their parachute payments were reduced once again, with both QPR and Reading at the end of their cycle.

The average broadcasting revenue among clubs not receiving parachute payments is around £8m compared to the £100m minimum available in the Premier League, showing why clubs and their owners go for broke to reach these riches.

However, a new EFL deal was agreed in 2018 for £595m for five years, a 35% increase. This will increase broadcasting revenue for Championship clubs going forward and slightly narrow the wide chasm between the Championship and Premier League.

Commercial Pittance

Championship 2018 Commercial Revenue

Commercial revenue makes up a fifth of Championship club’s revenue and is the main area for growth that the clubs can directly affect.

Many Championship clubs have huge followings due to the history behind their clubs. This history and fan base of these clubs could be better utilised and exposed to boost commercial revenue by many of these clubs.

Commercial revenue did in fact fall by 2% to £143m, a total less than the individual commercial revenue earned by Chelsea, Liverpool, Manchester City and Manchester United each.

The biggest earners commercially are Aston Villa (£17m), Leeds (£17m), Norwich (£12m) and surprisingly Bristol City (£10m) after their League Cup exploits. These 4 all earned more commercially than Bournemouth, Brighton, Burnley, Huddersfield, Stoke and Watford, showing the huge commercial appeal they have considering their league status.

Aston Villa will only grow further following promotion and will be hoping to get back towards their all-time high commercial revenue of £31m in 2014 and 2016.

On the other hand, many clubs in the Championship struggle to drum up commercial interest. Barnsley (£1m), Brentford (£2m), Hull (£3m), Millwall (£2m), Preston (£3m) and Sheffield United (£2m), all take well below the levels Championship clubs should be, especially considering some of the history and fan base of many of these clubs.

Of the clubs promoted that season, Wolves (£9m), Fulham (£9m) and Cardiff (£6m) should all see sharp rises in commercial revenue into the double figures, although Cardiff and Fulham’s relegations may put pay to that.

The declines of Ipswich (£4m) and Sunderland (£7m) will see their commercial revenue continue to plummet.

All in all, this is the biggest area of opportunities for Championship clubs. As more and more games are shown on TV and the quality continues to improve, sponsors are going to show further interest in the right clubs so long as they can capitalise.

I hope you enjoyed this article – Share with a fan!

Please follow and like us:
error

Premier League 2018 Finances – Revenue

Premier League 2018 Finances - Revenue

2018 was another thrilling season with Manchester City blowing away all competition to take the Premier League crown with ease. At the bottom of the table mainstays Swansea, Stoke and West Brom met their doom with relegation.

However, this article is about finances, and more specifically revenue and which clubs are bringing in the cash.

Revenue increased from an eye-watering £4.3bn to an even more outstanding £4.8bn, a more than half a billion rise in income and a 12% growth rate!

This is largely driven by the ever-increasing commercial appeal of the Premier League and improved performances in Europe by the top 6, further increasing the financial gap between the elite and the mid-table clubs.

The average revenue of a Premier League club is a cool £240m. This average shoots up to a jaw-dropping £460m among the top 6, showing how uneven the revenue is across the league and the near-impossible challenge of competing with their ever-growing riches.

Premier League 2018 Revenue

Revenue Growth

Premier League 2018 Revenue Growth %

As mentioned above, revenue grew by 12% to £4.8bn, as matchday (7%), commercial (12%) and broadcasting (13%) all experienced good levels of growth as the Premier League continues to grow richer.

Interestingly, the growth isn’t uniform across clubs, with 7 of the 20 teams experiencing a decline in revenue, largely due to performances on the pitch rather than commercial reasons.

The biggest movers were of course the promoted clubs, with Huddersfield experiencing growth of 734% as revenue increased from £15m to £124m after they successfully survived their first season in the Premier League against the odds.

Brighton also saw revenue grow by 399% from £28m to £138m, also surviving on their return to the Premier League.

Newcastle experienced only a doubling in revenue due to only being relegated the season prior, with revenue growing from £83m to an impressive £177m (114%) as they completed a clean sweep of survivals by the three promoted clubs.

Premier League 2018 Revenue Growth £m

Outside of this, the major movers were Liverpool (25%) and Tottenham (23%), whose performances in Europe and domestically saw a huge uptake in their revenues and led to huge profits too. Tottenham also benefitted from a season at Wembley which saw matchday revenue grow by 57% while Liverpool’s run to the Champions League Final helped them net an extra 43% in broadcasting revenue.

On the other end of the scale, Leicester saw the biggest decline in revenue, suffering from a European hangover after their one-time Champions League campaign ended with revenue falling from £231m to £158m (32%).

Arsenal suffered a dip of 9% to fall back below £400m in revenue (£386m) on the back of a less than successful season in Wenger’s final year as boss.

West Brom’s relegation saw their revenue drop by 9% to £125m as they fell from mid table to rock-bottom.

Matchday Money

Premier League 2018 Matchday Revenue

Matchday revenue is gradually becoming a smaller portion of top clubs’ revenue as they see commercial and broadcasting revenue sky rocket on the back of lucrative commercial sponsors and growing prize money.

Matchday revenue in the Premier League increased from £629m to £671m (7%) with the majority experiencing a small level of growth as ticket prices remained fairly static.

Manchester United brought in the most matchday income by a distance as the Theatre of Dreams continues to be the largest club stadium (Wembley being occupied by Spurs an exception), helping United bring home £110m, the only club in triple digits.

They are followed by Arsenal (£99m), Liverpool (£81m), Chelsea (£74m) and Tottenham (£71m) as fans flooded in to see their top teams play and compete for honours.

Manchester City lag their rivals in this area, bringing in only £57m due to a smaller stadium and the notorious empty seats rival fans taunt City about.

Outside the Top 6, Newcastle (£24m), Brighton (£19m), Southampton (£19m) and Everton (£16m) are the only clubs to have revenue from matchdays in excess of £15m, showing the gulf between the top 6 and the rest.

On the other end of the scale, Huddersfield take home a lowly £5m in matchday taking due to their 24,000-seater stadium and well-priced tickets which do no exclude anyone, something that should be commended.

Bournemouth (£7m), Swansea (£7m), West Brom (£7m), Burnley (£8m) and Watford (£8m) all had matchday revenue below £10m. Any growth is constrained by stadium size and price elasticities; therefore, it is unlikely these numbers will exceed £10m anytime soon.

TV Money

Premier League 2018 Broadcasting Revenue

Broadcasting revenue makes up the majority of Premier League clubs’ revenue, accounting for 59% of revenue and this only increases when excluding the top 6, with the Premier League prize the major source to the lower clubs that treasure survival as everything.

Broadcasting revenue increased from £2.5bn to £2.8bn (13%) as improved performance in Europe and a slight increase in Premier League distributions the major cause for this.

Liverpool were kings of broadcasting revenue and nearly Kings of Europe as their run to the Champions League final and 4th placed finish boosting their broadcasting revenue to £220m.

They were closely followed by Manchester City (£211m), Chelsea (£204m), Manchester United (£204m) and Tottenham (£201m), with Arsenal lagging their rivals at £180m after a disappointing campaign.

Premier League 2018 Payments to Clubs

Among the rest of the league they all vary between Everton at £130m and West Brom at £102m, primarily due to Premier League prize money based on final league performances, with the majority failing to enjoy lengthy cup runs (which do not boost revenue considerably anyway).

Europe is the big differentiator here, with a £90-118m gap down predominately to the lack of European adventures among those outside the top 6, showcased by Leicester seeing their broadcasting revenue drop from £191m to £124m!

The promoted clubs saw their broadcasting revenue rocket, with rises of £102m, 102m and £79m for Brighton, Huddersfield and Newcastle respectively, showcasing the riches available in the Premier League.

Liverpool are likely to once again lead in this category after going one step further and secure their sixth European title and will be closely followed by treble winning Manchester City and Europa League winners Chelsea, who incidentally are the top three in the Premier League this season.

Commercial Cash

Premier League 2018 Commercial Revenue

Commercial revenue continues to grow in importance for clubs as they looked to find other ways to pad their pockets. Commercial revenue grew by 12% to £1.3bn as companies continue to see value in the Premier League as a global stage for their brands.

Manchester United is a league of their own in this regard, taking home an impressive £276m from corporate partners as the biggest brand in English football continues to pull in the commercial cash despite falling on harder times on the pitch as of late.

They are being chased heavily by their Manchester rivals who have seen a commercial drive prove successful, taking their commercial revenue to £233m.

Their top 6 rivals lag significantly here with Chelsea (£170m), Liverpool (£154m), Tottenham (£109m) and Arsenal (£107m) all having room for improvement. Liverpool seem best placed to challenge the Manchester clubs after a return to prominence was capped off with the Champions League trophy in 2019 which will surely boost their profile and commercial revenue to new heights.

Everton (£43m), West Ham (£25m) and Newcastle (£24m) are the next biggest in a commercial sense due to their history, however they still lag the top 6 by huge amounts that make the ability to compete near on impossible.

Meanwhile, the three ‘Bs’, Bournemouth (£8m), Brighton (£9m) and Burnley (£9m) are the only clubs in single digits, however we would expect these teams to join their rivals by pushing past £10m in 2019.

Manchester United are likely to maintain a narrow lead of Manchester City in commercial terms next season, however the gap will close further.

Liverpool and Chelsea are likely to push close to the £200m barrier, while Tottenham are likely to increase their lead over their North London rivals after another good season.

Everton are likely to fall just short of the £50m mark while Leicester (£21m) are likely to overtake both Newcastle and West Ham as their profile continues to grow.

I hope you enjoyed this article – Share with a mate!

Please follow and like us:
error

Championship 2018 Finances – Wages

Championship 2018 Finances - Wages

2018 was another unpredictable season in the Championship with Wolves’ mega spending seeing them clinch promotion and the title. However, Cardiff were the surprise package, sealing the other automatic promotion spot while Fulham won the play-offs.

At the bottom of the table it was misery for Sunderland who were condemned to back-to-back relegations alongside Barnsley and Burton to League One.

However, this article is about finances, and more specifically wages and which clubs are teetering on financial ruin (most of them) and which clubs are being financially sensible (hardly any).

The 2017/18 season saw record levels of wages as the year on year growth in player salaries continued due to lure of the riches of the Premier League which saw financially gambling at large by owners.

Wages increased from an already high £693m to £748m, an 8% increase and the equivalent of an extra £1.1m a week in wages.

This is even more outstanding in context, Championship clubs’ combined revenue was only £701m, meaning clubs as a whole were losing money after just paying wages, not taking into account all other expenses a club faces, showing the huge financial issues clubs are facing in trying to compete.

The average wage bill of a Championship club is £34m (or £654k a week), ranging from £10m to £73m, showing the vast difference financially between many of the clubs, partly due to those clubs relegated.

This average increases to £54m across the top 6, showcasing that high wages do in fact correlate to some degree to position, although it is worth noting that at the bottom, the average falls to £28m (excl. Bolton), which isn’t far below the average of the whole league, showing that wages do not really decide much outside those at the top in terms of final league position.

Please note that Bolton are yet to release their finances due to their ongoing financial troubles while Sheffield Wednesday have so far yet to file their accounts which are long overdue.

Championship 2018 Wages

The Big Spenders

The big wage spender was Aston Villa in 2018, with their much publicised near financial destruction caused largely by spending a huge £73m on wages, this was partly helped by bringing in £69m (due to parachute payments).

Outside of this, Fulham (£54m), Norwich (£54m) and Wolves (£51m) all spent in excess of £50m on wages as Fulham and Wolves successfully secured promotion by big spending, although it is worth noting that these wages include significant promotion bonuses which wouldn’t have been payable without promotion.

Norwich’s wages were surprisingly high (after failing to reduce wages further following relegation two years ago) as they unsuccessfully gunned for a return to the Premier League, although they did manage it in 2019.

Modest Means

The less fortunate of the Championship teams this year were Burton (£10m), Barnsley (£11m), Millwall (£13m), Preston (£15m), Brentford (£17m), Ipswich (£19m) and Sheffield United (£19m) who all spent less than £20m on wages.

Unsurprisingly, Sheffield United and Millwall are near the bottom having both been promoted from League One the previous season and top half finishes for both far exceeded their modest budgets.

Barnsley and Burton were unsurprisingly relegated with their meagre budgets, doing well to survive in the prior season, with wages way below the average in the Championship.

Brentford, Preston and Ipswich all massively exceeded expectations on their budgets by securing top half finishes with Preston missing out on the play-offs by 2 points to a Derby County side who spent over triple their wages (£47m).

Best of the Rest

Everyone else is somewhere in between this gulf and we are going to have a look at a few of the more notable wage bills.

The relegated Premier League clubs all had relatively high wages but were not right at the top as Middlesbrough (£49m), Sunderland (£47m) and Hull (£31m) all successfully cut their wages following relegation to try and get their finances in order.

Cardiff’s wage bill was relatively high at £48m, although promotion was secured making the expense more than worth the risk.

Birmingham (£38m), Reading (£35m) and QPR (£31m) all flirted with financial disaster with high wages that massively exceed their lowly revenues and league positions and will need to be addressed going forward to avoid further financial issues and Financial Fair Play penalties.

Leeds continue their resurgence with surprisingly modest wages considering the talk around the club, spending a respectable £31m, although this is likely to be considerably higher under Bielsa in 2019.

Wage growth

Championship 2018 Wage % Change

There was a mixture of growth and declines in wages with 16 out of the 22 teams analysed experiencing some level of wage growth.

Sheffield United were the big movers with wages nearly doubling from £10m to £19m (90%) on the back of promotion. Despite this huge jump, the increase still left them near the bottom of the wage bills in the Championship as a £173k a week extra in wages is a lot less of an increase than many of the clubs.

Wolves unsurprisingly saw a huge increase in wages due to the special relationship they now have with Jorge Mendes under their new ownership and new star players. Wages increased from £28m to £51m (80%), a huge extra £433k a week in wages as they plotted their promotion.

Birmingham (71%) and Cardiff (67%) both showed renewed levels of ambition that saw wages increase by £304k and £373k a week and experienced very different experiences from their new high-earners.

Championship 2018 Weekly Wage Change

Leeds began their new era with an increase in wages of 52% to £41m, an extra £206k a week in wages.

Aston Villa increased their wages by 19% and £223k a week despite their unravelling finances with the board unable to see the issues (or recklessly gamble) until it was nearly too late.

On the other end of the scale, Hull saw wages drop by 49% to £31m following relegation, saving a huge £581k a week in wages as they looked to get their affairs in orders.

It was a similar picture for Sunderland who dropped wages by 43% to £47m, saving £691k a week in the process, a figure that will need to reduce once again in League One.

Middlesbrough cut wages by a quarter (25%) on the back of relegation, saving a more modest £312k a week as they looked to keep some players and gain promotion straight back to the Premier League, being unsuccessful with that to date.

Financial Instability

Championship 2018 Wage:Turnover

The wage to revenue ratio measures financial sustainability and prudence. If the ratio exceeds 100%, a club is spending more on wages than the revenue they bring in, which means the club is loss making before taking into all other costs they face, a situation that will lead to financial ruin in the long run.

The higher the ratio, the less profitable a club can be and the less sustainable they are. A club’s wage/turnover ratio should be around 60%, with one higher than 90% largely unsustainable and one lower than 40% a poor use of resources and essentially ‘too safe’.

Figures in excess of 100% are financially reckless and will be expensive for the owners as they have to fund large losses (unless players are sold).

The average in the Championship was a suicidal 115% in 2018, ranging from 56% to over 200%.

The lowest by a distance was Hull at 56% after successfully cutting wages following relegation and benefitted from parachute payments, although these will fall next season and this ratio will rise.

Sunderland (74%), Barnsley (76%), Leeds (77%), Burton (78%) and Middlesbrough (79%) all had ratios below 80% which is just about okay for financial sustainability. These ratios were all from clubs who were either relegated or promoted to the Championship, a usual trend.

Birmingham increased wages by 71% and this led to a wage/revenue ratio of 202%, meaning they are spending more than double their revenue on wages, hardly a good idea! This is likely to bring on various Financial Fair Play issues (as seen by their point deduction) as well as a burning hole in their owners’ pockets.

Other clubs at huge financial risk at their current wage and revenue levels are Reading (197%), Derby (161%), Brentford (135%), Nottingham Forest (122%) and Preston (113%) who are all putting themselves at risk of prolonged heavy losses and Financial Fair Play penalties.

Wolves (192%), Cardiff (148%) and Fulham (142%) all have high ratios that are skewed due to heavy promotion bonuses, although it is likely to still have been in excess of 100% without them, showing they were also playing with financial fire, however were more successful with their gamble.

All in all, Championship clubs are risking their financial future more than ever in an attempt to reach the Premier League promised land where riches await. However, as always only three clubs can reach their goals each year, leaving 10 to 15 teams disappointed and at significant financial risk.

It will be interesting to see how the EFL reacts to these increased financial gambles and the clubs who continue to side step Financial Fair Play sanctions by playing the rules.

Thanks for reading – Share with a friend!

Please follow and like us:
error

Premier League 2018 Finances – Wages

Premier League 2018 Finances - Wages

2018 was another thrilling season with Manchester City brushing away all competition to take the crown with ease. At the bottom of the table mainstays Swansea, Stoke and West Brom met their doom with relegation.

However, this article is about finances, and more specifically wages and which clubs are spending the big bucks.

The 2017/18 season saw record levels of wages as the year on year growth in player salaries continued due to the riches of the Premier League reach new heights.

Wages increased from an eye-watering £2.5bn to an even more outstanding £2.8bn, a 15% increase and the equivalent of an extra £7.2m a week in wages! 

This is largely driven by the mounting riches of remaining a Premier League club among the lesser teams and the need to compete in Europe and for trophies among the top 6.

The average wage bill of a Premier League club is £142m (or £2.7m a week). The average of the top 6 on its own is a jaw-dropping £242m (£4.7m a week), showing the vast difference financially between those at the top and the rest.

And despite the TV deal money stagnating in the most recent deal cycle, wage growth shows no sign of slowing down as clubs clamber to grab a share of the rising commercial revenue up for grabs.

Premier League 2018 Wages

The Big Spenders

The big wage spenders in 2018 were all up north, with Manchester United (£296m), Liverpool (£264m) and Manchester City (£260m) all spending in excess of £250m on wages (more than £4.8m a week).

Liverpool were the surprised package here as they began to make a concerted push to move back on their perch with big new signings such as Van Dijk and lucrative new deals for the likes of Salah, Mane, Firmino and co. that have so far been successfully.

Manchester City surprisingly saw a slight dip in their wage spend as incoming signings’ wages were recouped by selling and releasing deadwood.

Manchester United continued flexing their financial muscle, outgunning their neighbours to sign Sanchez on a mega deal which they are no doubt regretting. This added to an already bloated wage structure that continues to cause them trouble in discussions of new deals with the likes of Rashford and De Gea, who refuse to accept less than some of their underperforming team mates.

Tight Purse Strings

The paupers of the Premier League this year happened to be Huddersfield (£63m), Brighton (£78m) and Burnley (£82m) who all spent less than a third of what the big spending Scousers and Mancunians spent.

Outstandingly, all three of these clubs survived on their modest budgets, showing it’s not all about money, particularly Burnley who finished 7th, 11 places higher than their position in the wages table.

The low wages did however catch up to these clubs in 2019, with all three struggling near the foot of the table and Huddersfield were unable to stay afloat and fell to relegation, showing that maybe low wages are not sustainable over the long term. 

Best of the Rest

Everyone else is somewhere in between this gulf and we are going to have a look at a few of the more notable wage bills.

Tottenham continue to mix with the heavyweights on a featherweight’s diet, managing to maintain a wage budget of £148m more than £100m less than Manchester United, Liverpool and Manchester City and nearly £100m less than their London rivals Arsenal (£240m) and Chelsea (£246m).

It’s worth also noting the increased ambition shown on the blue side of Merseyside with Everton’s wages approaching the same level as Tottenham at £146m, hoping to replicate the success Tottenham have had, although that is yet to materialise.

Bournemouth and West Ham both broke the £100m wage barrier for the first time, spending £102m and £107m respectively as they both looked to move up the table and consolidate their Premier League status.

The three relegated clubs were near the bottom of the wage tree, with Swansea (£91m), West Brom (£92m) and Stoke (£94m) all spending less than a £100m on wages, a figure that will fall dramatically reduce following their relegations.

Wage Growth

Premier League 2018 Wage % Change

All bar two clubs (Manchester City and Newcastle) saw a growth in their wages. 

Huddersfield were the big movers with wages nearly tripling from £22m to £63m (188%) on the back of promotion. Given the unexpected nature of their promotion due to their modest Championship budget, this increase was necessary and still left them firmly at the bottom of the wage bills in the Premier League despite an extra £786k per week in wages.

Another promoted club in Brighton also saw a huge rise in wages, almost doubling from £40m to £78m (92%) in order to compete in the ultra-competitive Premier League, an extra £715k a week. 

Newcastle on the other hand already had a bloated wage bill following their relegation to the Championship and continued to trim the wages despite promotion as Mike Ashley looked to make it an attractive target as wages dropped from £112m to £94m (16%).

Premier League 2018 Wage Change

Bournemouth continued to grow as a club, spending an extra £585k a week, increasing their wages from £72m to £102m (42%). The same was the case for Burnley, who increased their wages from £61m to £82m (34%) as they consolidated their Premier League status.

Everton’s ambitions were shown by spending an extra £785k a week on wages, increasing their wages from £105m to £146m (39%), although the benefits are yet to be forthcoming under Marco Silva.

Liverpool were the big movers among the top 6 spending an unprecedented extra £1.1m a week in wages, while Arsenal (£783k a week), Chelsea (£479k a week) and United (£623k a week) were all free spending in 2018.

Financial Stability

Premier League 2018 Wage:Turnover

The wage to revenue ratio measures financial sustainability and prudence. If the ratio exceeds 100%, a club is spending more on wages than the revenue they bring in, which means the club is loss making before taking into all other costs they face, a situation that will lead to financial ruin in the long run.

The higher the ratio, the less profitable a club can be and the less sustainable they are. A club’s wage/turnover ratio should be around 60%, with one higher than 90% largely unsustainable and one lower than 40% a poor use of resources and essentially ‘too safe’.

The average in the Premier League was 63% in 2018, ranging from 39% to 78%.

Tottenham were the lowest at 39%, with the prudent Daniel Levy taking tight to new levels, although the low ratio is partly due to a huge upturn in revenue that diluted the ratio significantly. New deals for Alli and Kane among others will see this ratio rise closer to 50% (although 2019 revenue is expected to rise), while they also have to manage finances due to their new stadium.

The top 6 continue to run financially smoothly despite their huge wage bills with Manchester United (50%), Manchester City (52%), Chelsea (55%), Liverpool (58%) and Arsenal (60%) all having ratios of less than 60% due to their high revenue which justifies their star players’ salaries.

The Promoted clubs were also in a healthy range with Huddersfield (50%), Newcatle (53%) and Brighton (56%) all in the 50s as the huge boost in revenue exceeded their rising wages (or falling wages in Newcastle’s unusual case).

Outside of this and among the mid table gang, the majority of ratios exceed 70%, a poor place to be in. Crystal Palace (78%), Everton (77%), Bournemouth (76%), Leicester (75%), Southampton (74%), West Brom (74%) and Swansea (71%) are all approaching the financial risk area.

Burnley’s ratio can be explained by bonuses following a great season but not much can be said for those outside this.

West Brom, Stoke and Swansea will need to drop wages fast to avoid financially issues following relegation with large losses on the cards if not.

Bournemouth and Southampton must be careful to not over exert themselves financially in a bid to survive and grow and make smart investments or risk financially ruin.

Everton need to trust that they are making the right moves and that revenue catches up with their rising wages soon to avoid the need to sell key players or revert to a much smaller budget and level of ambition.

I hope you enjoyed this article – Please share with a friend!

Please follow and like us:
error

Championship 2018 Finances

Championship 2018 Finances

Have a look at the finances of all Championship clubs from the 2017/18 season!

Find your club and share with a friend!

Aston Villa – Financial Limbo

Aston Villa Finances 2018

Barnsley – Relegated But Ready

Barnsley Finances 2018

Birmingham City – Midland’s Mess

Birmingham Financial Review 2017:18

Bolton – Unavailable due to Administration

Brentford – Much of the Same

Brentford FC's 2018 Finances

Bristol City – Robins in Red

Bristol City FC's 2018 Finances

Burton – Living Within Your Means

Burton Albion FC's 2018 Finances

Cardiff – The Promotion Penalty

Cardiff Financial Review 2018

Derby County – Pride Park Profits

Derby County FC's 2018 Finances

Fulham – Craven Losses

Fulham FC's Finances 2018

Hull City – The Cost of Relegation

Hull City Financial Review 2017:18

Ipswich – Out of Gas

Ipswich Town FC's 2018 Finances

Leeds United – New Era

Leeds United's 2018 Finances

Middlesbrough – Riverside Reeling

Middlesbrough Financial Review 2017:18

Millwall – The Lions Roar

Millwall Financial Review 2017:18

Norwich City – Canaries’ Cash

Norwich FC's 2018 Finances

Nottingham Forest – A New Era

Nottingham Forest Financial Review 2018

Preston – Profits but no Play-Offs

Preston Finances 2018

QPR – FFP Hits

QPR Financial Review 2017:18

Reading – Royals Flushed

Sheffield United – Blades Cut Losses

Sheffield United Financial Review 2018

Sheffield Wednesday – Accounts are overdue and are yet to be released – To be updated

Sunderland – Back to Back

Sunderland FC's 2018 Finances

Wolves – Financial Fosun Play

Wolves Finances 2018
Please follow and like us:
error

Burton Albion FC’s 2018 Finances – Living Within Your Means

Burton Albion FC's 2018 Finances

Burton suffered from second-season syndrome after being unable to upset the odds again and survive for a second season in a row in the Championship, finishing 23rd.

It was always going to be an uphill struggle due to their shoestring budget, however they fought valiantly and were narrowly relegated by 2 points.

Burton didn’t fare much better in the cups but did enjoy a lucrative tie in the EFL Cup at Old Trafford, ending in a 4-1 defeat to Manchester United. Burton were also eliminated from the FA Cup in the Third Round.

Relegation and rising costs saw profits fall from £1.2m to £0.4m (67%), which is still more than the majority of Championship clubs who run themselves a lot less sensibly (financially).

Let’s delve into the numbers.

Burton Albion Profit:Loss 2018

Revenue Analysis

Burton Albion 2018 Revenue

Burton’s second season in the Championship ending in relegation didn’t stop revenue from rising, increasing from £11.4m to £12.9m (13%).

Matchday revenue rose from £1.5m to £1.8m (20%) despite average attendances falling from 5,227 to 4,645 (13%) due to lucrative cup ties and increased ticket prices. A sensational run to the EFL Cup Semi-Finals should boost matchday revenue once again.

Broadcasting & Commercial revenue rose from £9.9m to £11.1m (12%) on the back of increased EFL Championship distributions despite a lower finish and the lucrative tie with Manchester United in the EFL Cup.

Commercial revenue also benefited from a second successive year in the Championship.

Looking ahead, Burton were unable to bounce straight back to the Championship and revenue will be hit significantly as a result.

The lower prize money in League One will see broadcasting revenue fall significantly. This will however be offset slightly by their EFL Cup run.

Revenue will however take a beating and will fall by around half to £5-6m most likely.

Costs Analysis

Burton Albion costs 2018

Burton saw costs grow at a faster rate than revenue, hurting profitability. Costs rose from £10.2m to £13.3m (30%) as the increased costs of remaining competitive in the Championship continues to rise.

Amortisation increased from £350k to £475k (36%) which is still very low for a Championship club. The rise was largely due to an increase in transfer spending, with Burton not spending transfer fees for a while prior to promotion ahead of the 2016/17 season.

Burton had a net interest income of £1.7m, a huge change from the net interest expense of £0.2m in 2017. What this interest income relates to is unhelpfully not disclosed and is likely to relate to transfer fee interest receivable on instalments (unlikely due to the lack of previous transfers) or loans to their owner (although this should have been disclosed in the accounts).

Burton paid tax of £105k on their profit before tax of £500k, an effective tax rate of 20%, in line with the corporate tax rate of 19%.

Burton Albion Wages 2018

Burton saw wages rise to record levels, breaking the £10m barrier as wages increased from £7.7m to £10.0m (30%) as players were rewarded with bonuses and new contracts on the back of survival last season and new signings commanded higher wages.

This wage rise works out at a measly extra £44k a week, showcasing the tight budgetary controls Burton work under, showing what an achievement it was to even survive last year!

Directors of the club were paid £63k, having received no renumeration in 2017.

Looking ahead, costs will fall out of necessity after relegation as key players leave and relegation wage drop clauses come into effect. With revenue likely to halve, Burton will be hoping costs go someway to covering that, although it is almost certain Burton will make a loss of at least a couple of million in 2019.

Transfers Analysis

Burton Albion Net Transfer Spend 2018

Burton are a club of modest means, working tirelessly and above expectations on a small budget and 2018 was no different as the club spent a tiny £0.5m on one player, which was all recouped and then some by one sale.

In came Liam Boyce for £0.5m and out went Jackson Irvine for £1.9m, a net transfer income of £1.4m after a net transfer spend of £0.3m in 2017.

Liam Boyce proved a decent signing, chipping in with some crucial goals in their relegation battle although Irvine was missed throughout the season.

The sale of Irvine netted Burton a profit on his sale of £0.8m, a vital amount in keeping Burton in a profitable position.

In cash terms, Burton spent £1.1m (of which much relates to prior periods) and received £1.3m (further cash will be due although not disclosed in the accounts), a net cash inflow of £0.2m.

The sale of Irvine helped Burton record a profit and with no such sales in 2019, Burton are set to make a loss before taking into account the fall in revenue due to relegation.

Debt Analysis

Burton Albion Net Debt 2018

Burton saw cash levels completely depleted after a difficult season, falling into their overdraft as cash of £0.8m was wiped out.

The cash was used to fund their loss (before taking into account transfers) and to pay for improvements to the club’s infrastructure of £0.5m (although this was down from £1.3m in 2017).

Debt levels remained at £0.1m, being their overdraft facility. Their owner has run the club debt-free, placing no loan burden on Burton as the club continue to live within their means.

This is a noble practice but makes future growth difficult without further investment and with rising costs, remaining profitable in the Championship, let alone League One, is become more onerous by the season.

Burton fans will be hoping for at least some injection of funds going forward to push back into the Championship and hopefully stay for a while this time. Without it, Burton risk a prolonged and unprofitable stay in League One for some time.

Thanks for reading – Share with a fan!

Please follow and like us:
error

Bristol City FC’s 2018 Finances – Robins in Red

Bristol City FC's 2018 Finances

Bristol City had a solid 2017/18 season, finishing 11thin a strong Championship campaign which gave fans hope of a potential play-off place before eventually finishing a few places short.

Fans were however ecstatic after a sensational run to the EFL Cup Semi-Finals before ultimately succumbing to a 5-3 aggregate defeat to Manchester City in a valiant effort by The Robins.

The season will fondly be remembered by their fans after beating 3 three Premier League teams on their cup run, including a shock win over Manchester United.

Despite a good season, losses tripled from £6.3m to a record-high of £25.2m (300%) due to rising costs and a the lack of profitable player sales compared to 2017, putting the club at risk of Financial Fair Play penalties as cumulative 3-year losses rose to £46.3m.

Let’s delve into the numbers.

Bristol City Profit:Loss 2018

Revenue Analysis

Bristol City 2018 Revenue

Bristol City saw revenue rise to record levels despite their rising losses, with revenue increasing from £21.2m to £26.0m (23%).

Bristol City saw revenue rise to record levels despite their rising losses, with revenue increasing from £21.2m to £26.0m (23%).

Matchday revenue was a major reason for the rise in revenue, increasing from £5.0m to £6.6m (32%) due to their EFL Cup run that netted the club 5 Premier League ties (including two legs versus Manchester City). This revenue was split as £3.4m (2017: £2.1m) of matchday revenue and £3.2m (2017: £2.9m) in season ticket sales.

Attendances also rose from 19,256 to 20,952 (8%) due to an upturn in form on the pitch in both the EFL Cup and Championship.

Broadcasting revenue rose from £6.8m to £7.8m (15%) due to additional prize money received from finishing 6 places higher in the Championship and the additional EFL Cup prize money.

Commercial revenue rose from £8.5m to £10.4m (22%) as the club benefitted from the exposure of their giant-killing status and an increase in commercial interest and merchandise sales.

Other revenue rose from £0.9m to £1.2m (33%).

Looking ahead, another solid season saw Bristol City narrowly miss out on the play-offs, finishing 8thplaced and 4 points off the play-off places. Roles were also reversed in the EFL Cup with Bristol City shocked in the 1stRound by Plymouth. 

The increased Championship distributions and higher finish should see broadcasting revenue rise, while they also reached the Fifth Round of the FA Cup, which may be just as lucrative, if not more so than their EFL Cup run last year.

Matchday revenue is likely to fall due to less home games this season, while commercial revenue is likely to stabilise at around £10m. Overall revenue is unlikely to increase significantly.

Expense Analysis 

Bristol City costs 2018

Rising revenue was met by rising costs with expenses increasing from £39.7m to £51.2m (29%) as the costs to compete in the Championship continue to rocket due to the prize on offer with promotion. 

The growth in costs (29%) was slightly higher than that of revenue (23%), harming profitability. 

Amortisation increased from £5.2m to £7.8m (50%) due to the new level of spending the club are currently experiencing, spending £23.4m in the last two seasons compared to £7.5m in the five years before that.

Interest costs increased from £0.9m to £1.3m (44%) as interest costs on their overdraft and borrowing rose by £0.4m.

Bristol City Wages 2018

Wages rose significantly, increasing from £20.9m to £27.3m (31%) on the back of their new spending power and the influx of new players.

This wage increase worked out an extra £123k a week, relatively mediocre compared to other Championship clubs. The Championship continues to grow financially with clubs’ willingness to ramp up risk with high wages in the hope of gaining promotion.

Crazily, wages are more than revenue, which means Bristol City are losing money before taking into account any other costs, a financial unstable position that needs to be swiftly remedied and partly explains the sale of key players in 2018/19.

Directors on payroll at the parent company were paid slightly less this year, with renumeration falling from £115k to £109k (5%) despite improved results.

However, key management were paid elsewhere in the group and saw their wages rise from £1.0m to £1.4m (40%) due to these results.

Looking ahead, costs are likely to be at a similar level and may even fall after the likes of Reid, Flint and Bryan left freeing up wage savings that don’t seem to be have been used in full this year. The growing concerns of Financial Fair Play seem to have led to Bristol City curbing spending which may see an improved, more profitable team in the 2019 accounts.

Transfers Analysis

Bristol City Net Transfer Spend 2018

Bristol City saw their biggest transfer net spend to date in 2018, spending £12.1m and only bringing in £3.0m as 4 players arrived at Ashton gate and one departed.

In came, Diédhiou (£5.4m), Baker (£3.9m), Eliasson (£1.8m) and Walsh (£1.0m) for a combined £12.1m.

The only player to depart was Tomlin for £3.0m.

This led to a net transfer spend of £9.1m, up from a net transfer income of £1.4m in 2017.

The signings did okay with existing players leading the way in their promotion push with Diédhiou at least adding a few goals up front to supplement Bobby Reid who had a great season.

The sale of Tomlin netted Bristol City a modest £0.3m profit on player sales compared to the £13.6m recorded in 2017 due to the sale of Kodjia. This explains the majority of the increased losses, with the rest due to the larger rise in costs than revenue.

This loss is likely to be turned into a decent profit next year due to the sales of Reid, Flint and Bryan for sizeable profits.

In cash terms, Bristol City spent cash of £10.6m on transfers and received £7.3m, a net cash outlay of £3.3m, a manageable amount.

Bristol City are due a further £4.7m in transfer fees however owe £6.2m (£5.1m of which is due this year), a net creditor position of £1.5m which constrained transfer spending slightly in 2019 (although Financial Fair Play was a bigger concern).

Bristol City could also owe a further £0.3m in contingent transfer fees, however they could be owed £1.0m from other clubs themselves.

Debt Analysis 

Bristol City Net Debt 2018

Bristol City operate with minimal cash reserves with their shallow cash pool depleted further, falling from £0.5m to £0.3m (40%).

Rising losses were funded with new funds of £19.0m comprising of £18.7m in capital from their owners and £0.3m in bank loans.

These funds were also used to fund their transfer spending and infrastructure improvements of £1.1m.

The funds provided by their owners were from an issue of new shares and hence are not repayable by the club as their owners show ambition by ploughing money into the club in the hope of promotion.

Debt levels hence increased ever so slightly, rising from £71.2m to £72.0m (1%), due to a £0.3m new bank loan and an increase in their overdraft.

Net debt levels hence rose from £70.7m to £71.7m (1%) as the majority funds were provided by equity, sparing the club from repaying them.

Going forward, further investment will be necessary for The Robins to gain promotion to the Premier League. Signs are mixed currently following the sale of key players in a bid to recoup previous spending and meet Financial Fair Play regulations.

The club are continuing to invest in their future. Following the successful redevelopment of Ashton Gate, Bristol City are at an advance stage in revamping their training ground which should help take them to the next level.

Bristol City are at a cross road on whether to push hard and take financial risk to reach the Promise Land, only time will tell which path they choose…

Thanks for reading – Share with a fan! 

Please follow and like us:
error

Premier League 2018 Finances – Find Your Club

Have a look at the finances of all Premier League clubs from the 2017/18 season!

Find your club and share with a friend!

Arsenal – Wenger Out, Cash Still In

Arsenal Financial Review 2017:18

Bournemouth – Howe You Doin’?

AFC Bournemouth Finances 2018

Brighton – Seagulls Soaring

Brighton & Hove Albion's Finances 2018

Burnley – Moor Profits

Burnley FC's 2018 Finances

Chelsea – Russian Roulette

Crystal Palace – No Transfers, No Profits

Crystal Palace FC's 2018 Finances

Everton – Merseyside Blues

Everton FC's Finances 2018

Huddersfield – Premier Profits

Huddersfield Town FC's Finances 2018

Leicester City – European Hangover

Leicester City FC's Finances 2018

Liverpool – Klopping Profits

Liverpool Financial Review 2018

Manchester City – Guardiola-Sized Gains

Manchester City Financial Review 2017:18

Manchester United – Strong and Stable Leadership

Manchester United Financial Review 2017:18

Newcastle United – Promotion Pays

Newcastle United's 2018 Finances

Southampton – Virgil Van Profits

Southampton FC's Finances 2018

Stoke – Cold, Wet and Windy

Swansea – Sinking Swans

Swansea FC's 2018 Finances

Tottenham – World Record Profits

Tottenham FC's 2018 Finances

Watford – Mixed (Marco) Bag

Watford FC's Finances 2018

West Brom – Red & Relegated

West Brom's Finances 2018

West Ham – Hammered

West Ham Financial Review 2017:18

Please follow and like us:
error