Tottenham Hotspurs’ 2018 Finances – World Record Profits

Tottenham FC's 2018 Finances

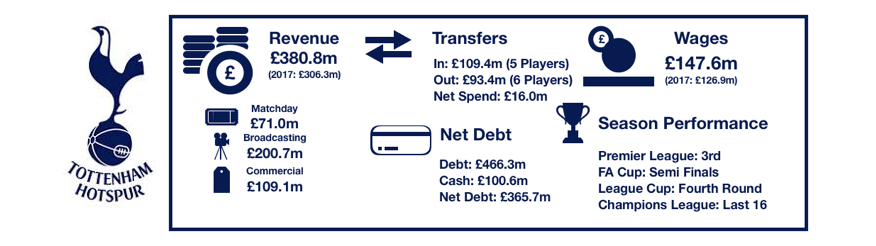
Tottenham enjoyed another fine season in what has been a great spell for the club under Pochettino, finishing 3rdand securing another season in the Champions League while at their temporary home of Wembley.

Despite this success, Tottenham were once again called out on their lack of trophies, having failed at the Semi-Final Stage, Last 16 and Fourth Round in the FA Cup, Champions League and League Cup respectively.

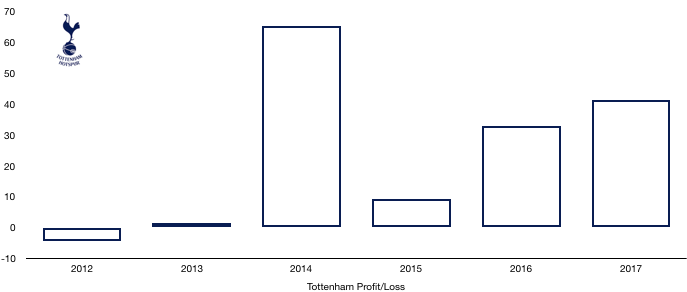
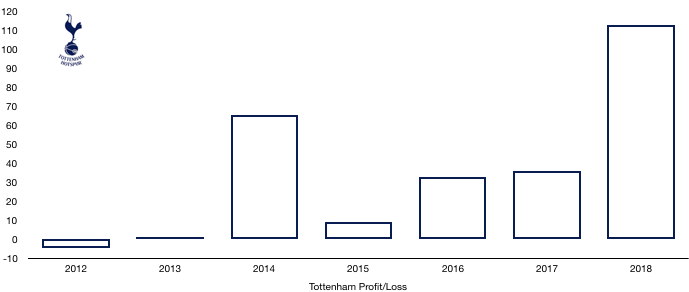
However, Levy has much to be happy about having steered Tottenham to this point on a low budget, helping Tottenham record a world record profit of £113.0m, up from an already impressive £36.2m (212%).

Let’s delve into the numbers.

Tottenham FC Profit:Loss 2018

Revenue Analysis

Tottenham FC 2018 Revenue

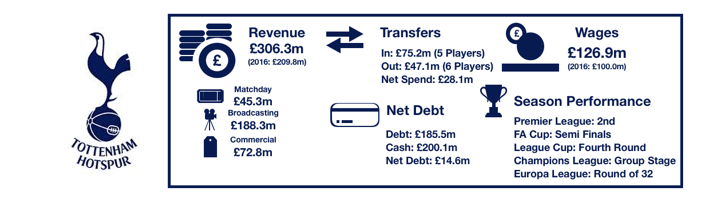
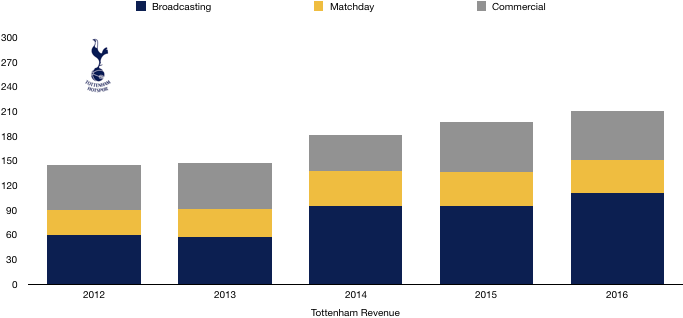
Tottenham saw their revenue increase to record levels, rising from £309.7m to £380.7m (23%) as the club benefitted from their move to Wembley and their new Nike deal.

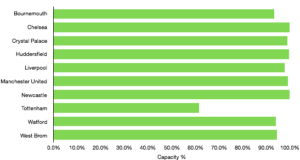
Matchday revenue increased significantly from £45.3m to £71.0m (57%) as the move to Wembley proved extremely lucrative for Tottenham. Average attendance more than doubled from 31,639 to 67,953 (115%), although to fill seats tickets were on average cheaper.

Broadcasting revenue increased from £188.2m to £200.7m (7%). This increase was mainly due to entering the knockout phases of the Champions League, having failed to in 2017, with UEFA prize money increasing from £38.4m to £53.1m (38%), while Premier League TV money actually fell from £150.0m to £147.6m (2%) as they dropped a place in the Premier League.

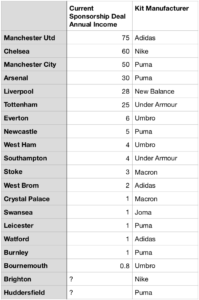
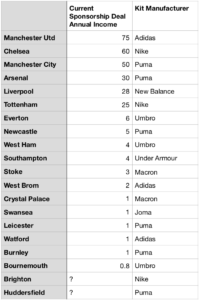
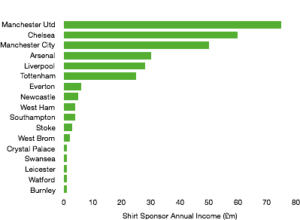
Commercial revenue grew well, rising from £76.2m to £109.1m (43%) as Tottenham replaced their deal with Under Armour (£10m per annum) with a much more lucrative 15-year deal from Nike (£30m per annum).

Looking ahead, Tottenham should see some revenue growth this year. Tottenham have played the majority of their games at Wembley again this year so matchday revenue will be relatively stable considering they will have a similar number of home games this year.

Broadcasting revenue should increase with Tottenham reaching at least the Quarter Finals of the Champions League this year. Premier League revenue is likely to fall unless Tottenham can match last seasons’ 3rdplaced finish, while they also performed worse in the FA Cup which will harm revenue in this area. Commercial revenue should also continue its upward trajectory with Tottenham’s popularity and stature continually growing.

Costs Analysis

Tottenham FC Costs 2018

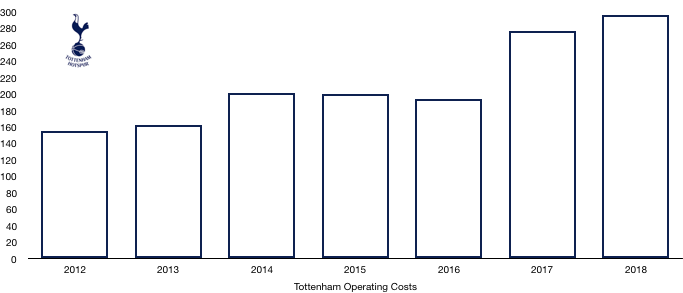
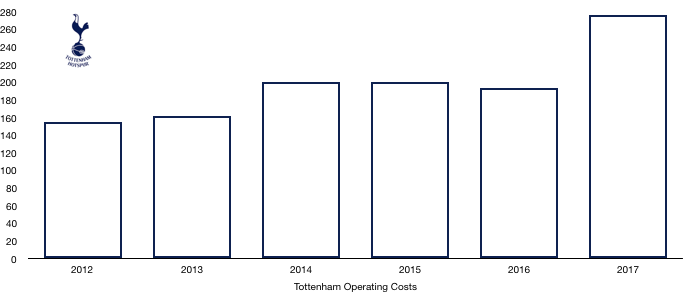
Tottenham managed their costs to perfection in 2018 under strict orders from Daniel Levy. Cost rose slightly from £276.7m to £296.7m (7%). With revenue rising by 22%, keeping costs rises down to 7% is incredible considering the higher level Tottenham have maintained, this has significantly boosted profitability.

Amortisation increased from £42.9m to £57.5m (34%) after an influx of new players replaced existing players who had been at the club for some time, with the rise in amortisation signifying reinvestment. 

Amortisation is likely to fall this year following little transfer activity at the North London club.

Lease costs increased from £1.1m to £1.4m (22%).

Net interest costs fell from £21.2m to £18.1m after interest rates fell on some of their loans.

Tottenham also paid tax of £26.0m, an effective tax rate of 18% which is largely in line with the statutory rate of 19%.

Tottenham stadium is the most interesting part of their current finances and the delayed entry and spiralling costs has peaked everyone’s interest. 

At the beginning of the year, Tottenham had spent £517.5m after initially expecting this to be around the full cost of the stadium. However, this year they have had to fork out an eye-watering £514.1m due to overruns, taking the total costs of the stadium to over a billion pounds! This has considerably affected their finances and transfer plans, leading to additional loans (see debt analysis).

Tottenham FC Wages 2018

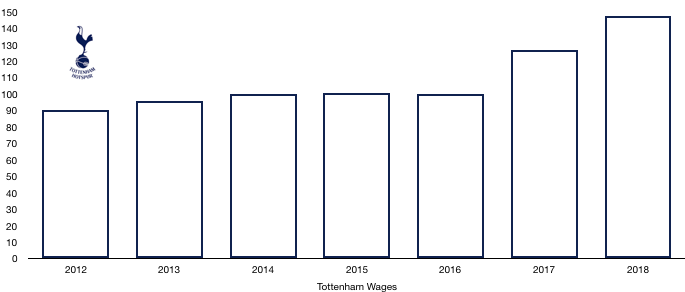
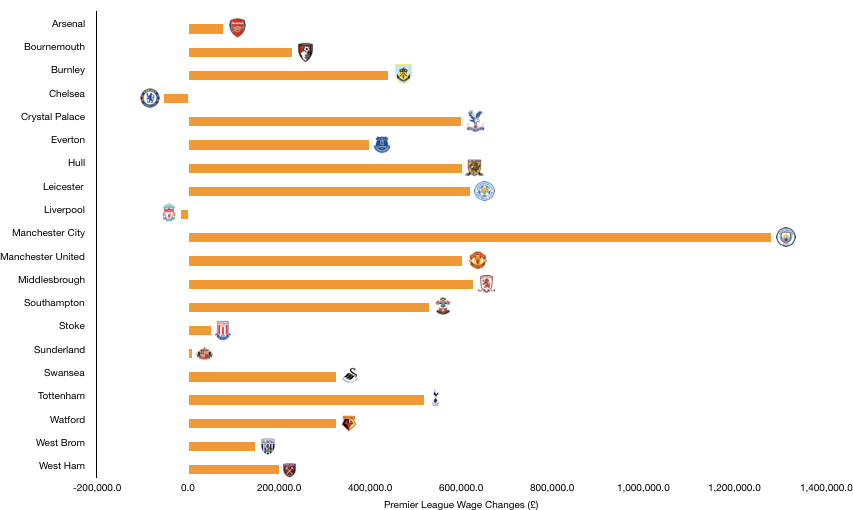
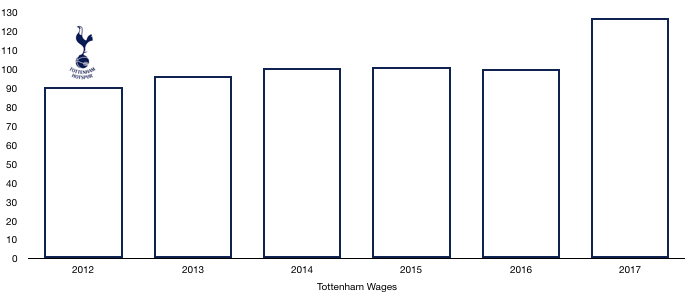
Wage control persisted this year with a stadium to pay for, but wages did still rise from £126.9m to £147.6m (18%) on the back of the new signings while their key players were rewarded with new, lucrative contracts after another excellent season.

The increase in wages works out at an extra £398k a week, the minimum Tottenham needed to remain competitive with the wage rise at their rivals surpassing this considerably.

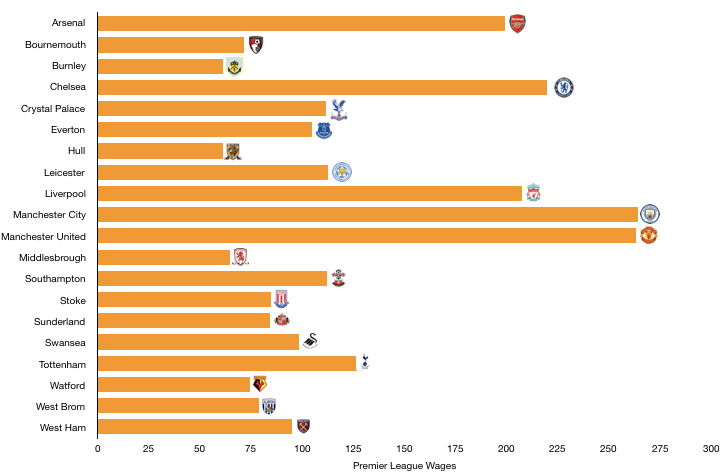
Despite this wage rise, Tottenham are still way below their rivals with United (£295.9m), Liverpool (£263.6m), City (£259.6m), Chelsea (£245.7m) and Arsenal (£240.1m) all paying well above the wages on offer at Tottenham. 

This showcases what a great job the club are doing to remain competitive among these financial giants, highlighted even further by the fact Everton (£145.5m) pay around a similar amount in wages to Tottenham.

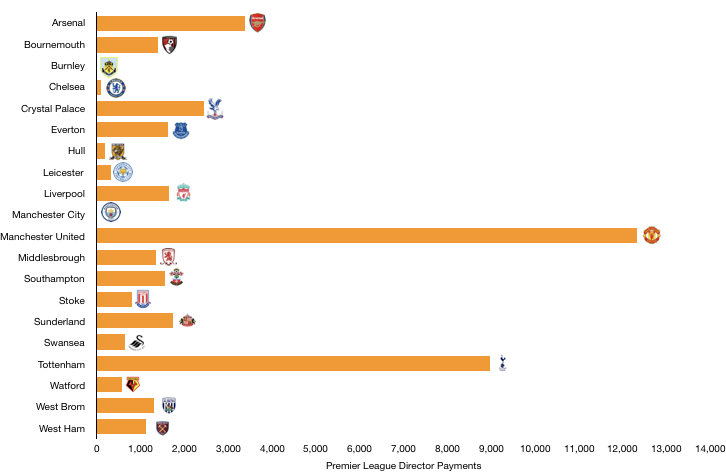
Director remuneration more than halved as they sacrificed in the short term due to the stadium, with remuneration falling from £9.0m to £4.2m (53%), while Levy saw his pay halved from £6.0m to £3.0m, with the previous bumper pay being due to back dated bonuses that hadn’t been paid, so his renumeration was always expected to decrease this year.

Looking ahead, Costs are likely to increase slightly next year. Wages will rise slightly due to new contracts with the only incoming or outgoing of note being Dembele, amortisation will fall due to the lack of investment. 

Costs are likely to rise a bit due to stadium maintenance costs that will now be incurred on the New White Hart Lane following the move into the stadium this week.

Profits are likely to plummet next year despite no major increase in costs or revenue as transfer sales were a major part of their profit this year, and with no major outgoings, this will hit profit considerably as will be seen in the next section.

Transfers Analysis

Tottenham FC Net Transfer Spend 2018

There has been little transfer activity since 2018 with Tottenham signing no players this season. However, 2018 was a busy transfer season for Tottenham as they signed 5 players and sold 6.

In came Sanchez (£36.0m), Lucas (£25.6m), Aurier (£22.5m), Lllorente (£13.6m) and Foyth (£11.7m) for a combined £109.4m. 

Out went Walker (£47.4m), Wimmer (£17.5m), Bentaleb (£17.1m), N’Jie (£6.3m), Fazio (£2.9m) and Jannsen (Loan – £2.3m) for a combined £93.4m.

This led to a net transfer spend of £16.0m, their second successive net spend.

Sanchez, Lucas and Aurier all proved to be class signings for Tottenham, adding quality to the squad while Llorente added depth and Foyth was one for the present and future and has shown potential.

Meanwhile, Tottenham received good fees for Walker and great fees for Wimmer and Bentaleb given the quality they showed at White Hart Lane.

Tottenham recorded a profit on player sales of £73.1m mainly due to the sales of Walker and Bentaleb and this went a long way in securing their record profit levels. Tottenham would have still been profitable without any sales which is an impressive and unusual feat.

In cash terms, Tottenham spent cash of £79.9m and received £73.8m, a net cash outlay of a measly £6.1m which is peanuts for a club the size of Tottenham.

However, Tottenham do owe a further £108.4m (£44.1m of which is due this year) and are only owed £40.2m (of which £36.1m is due this year), a net owing position of £68.2m (£8.0m this year). 

This has clearly (along with the bigger reason of their stadium) affected their transfer plans with this £68.2m needing to be paid in the coming season or two, hopefully they will have some cash to spend this summer.

There is also the further possibility of owing £14.9m to clubs/agents and £16.9m to players should certain transfer clauses be met, although it unlikely the full amount of either balance will ever become payable.

Debt Analysis 

Tottenham FC Net Debt 2018

Tottenham built up a sizeable cash balance in 2017 and this was halved from £200.1m to £100.6m (50%) due to the development of New White Hart Lane.

Increased revenue and profits and the existing cash balance were used to pay for transfers and part of the huge £492.9m cash outlay Tottenham spent this year on their stadium.

This amount was nowhere near enough, so Tottenham needed new loans of £279.4m to help fund this.

Debt hence more than doubled from £185.5m to £466.3m (151%) on the back of the huge new loans needed to fund the stadium and its inevitable overruns.

Investec have loaned Tottenham £21m until 2022 as part of their stadium funding.

However, the main bulk has come from a consortium of HSBC, Goldman Sachs and America Merrill Lynch who have provided £445.3m so far, with Tottenham having the ability to increase this to £537m. All amounts are due to be repaid by 2022, which is only 3 years away and seems a push that it will all be repaid by then (it will most likely be renegotiated or refinanced elsewhere).

The average interest costs across these loans is around 3%.

Levy has pledged £50m of loans as well should it be needed, although this hasn’t been touched yet.

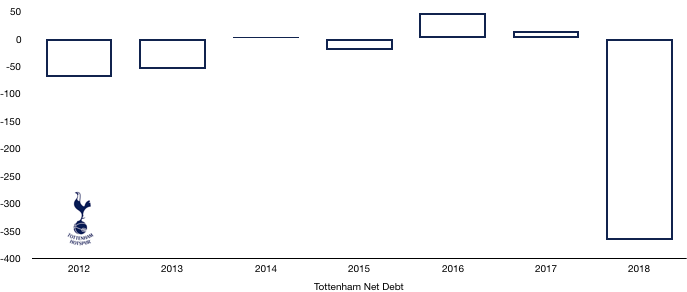
Tottenham hence moved from a net cash position of £14.6m to a huge net debt position of £365.7m as would be expected given the scale and ambition of their new stadium.

This represents a huge change in the debt profile of Tottenham however this stadium is going to pay dividends going forward, increasing matchday income and generating considerable commercial opportunities.

The key now is to guarantee Champions League football next season, because without it, repaying the stadium loans will become more difficult and stretch their budget further, hurting any ability to bring in new players the club desperately need to remain competitive.

It remains to be seen the full effect a demotion to the Europa League football would have, and it’s not a thought Tottenham fans or Daniel Levy even want to contemplate.

Thanks for reading – Share with a friend!

Please follow and like us:
error

Liverpool – The Kop’s Commercial Weakness

Liverpool Commercial Revenue Compared

Liverpool FC released their financial results recently to great fanfare, record profits, growing revenue and a competitive wage structure were all reasons for Liverpool fans to get excited. Among all this excitement the composition of their revenue went under the radar.

Liverpool Revenue 2018

Roughly half of their revenue was from TV money and prize money, which although shows success in a season, isn’t something that can be relied upon each year. Unless your Real Madrid or Barcelona, Champions League finals/trophies are a rare occurrence due to the strength of the competing rivals.

Roughly a fifth of Liverpool’s revenue came from matchday earnings which has remained fairly stable but is increasing as the capacity of Anfield increases.

This leaves around a third of Liverpool’s revenue being from commercial revenue. Commercial revenue is made up of sponsorship deals and merchandise sales. This is the area where Liverpool are below Europe’s top table and an area that has significant room for improvement.

The Problem

Commercial Revenue 2018

The graph above shows the potential Liverpool have to grow this area of revenue and boost income significantly to boost their financial muscle. Liverpool’s commercial revenue is the 8th highest in Europe according to Deloitte and is less than half the amount Real Madrid command. Although no one is saying Liverpool are as big a club as Real Madrid, the difference is much bigger than it should be.

Liverpool lag their northern rivals in Manchester significantly too, by more than £100m in Manchester United’s case. This gap needs to shrink if Liverpool are serious about mixing with Europe’s finest.

Mr. Popular

Social Media Following Football 2018

The reason Liverpool have so much potential and are currently under achieving when it comes to commercial revenue is the growth the club has experienced in popularity and appeal worldwide under Klopp.

Liverpool have struggled over the past couple of decades to ‘get with the times’ and match their rivals in digital popularity as football moved into the modern era. Manchester United perfectly exploited and channelled the new commercial era and as a result saw their finances explode with Liverpool playing catch up ever since.

However, Liverpool are catching up and are ahead of many in terms of social media followers. The club have the 6th highest number of twitter followers of the twenty teams to make up the Deloitte Money League. They also have 9th highest number of followers on Instagram which could be improved upon with more engagement and is an area for growth.

The club only has the 10th highest number of Facebook ‘likes’ and should look at these platforms as areas that could grow significantly. In all these areas they aren’t far of moving further up the social media chain as the club engage to a greater extent with the fans and their success on the pitch attracts more digital fans.

The importance of this nowadays cannot be underestimated, a club’s social media pull gives companies a great way to advertise directly to their target market being football fans or geographical location. A greater number of followers makes it much easier to negotiate lucrative sponsorship deals, especially the smaller club partners who can make up a considerable amount of a club’s commercial revenue.

Kitted Out

Shirt Sponsorship Deals Football 2018

Liverpool currently earn roughly £28m from their kit manufacturer New Balance annually. This is almost a third of the amount Manchester United attract in their £75m deal with Adidas and 5 times less than Barcelona’s high of £140m from Nike.

Liverpool are (and should be) entertaining offers from the likes of Adidas and Nike as they look to match, if not exceed the amount earned by Manchester United when their deal with New Balance runs out at the end of next season.

Liverpool should be able to increase their kit deal significantly as Manchester United negotiated their deal a few years ago so by now, this should be well within the grasp of Liverpool considering the growth in popularity the club has sustained of late.

Their current deal is also below the likes of Chelsea and Manchester City, clubs of a similar stature social media wise however Liverpool also have a larger fan base outside of this and would therefore hope to command at least in excess of the £50m Manchester City recently negotiated with Puma.

Getting More Shirty

Kit Sponsorship Deals Football 2018

Liverpool have stayed loyal to their shirt sponsors historically, seemingly married to Carlsberg until they parted ways a few years ago and Standard Chartered took their place. Liverpool chose wisely and have recently renegotiated their deal on £40m a year for four years, up from £30m. This was a shrewd move and Liverpool are doing well in terms of their shirt sponsor and there is not much room to improve in this area.

The club should focus on maintaining a good working relationship with Standard Chartered and negotiate at the appropriate time to improve the terms, maybe by incentivising additional performance related bonuses that will reward the club on the back of successes on the pitch.

Opportunity Knocks

Liverpool have many additional areas that could enhance commercial revenue with some controversial and others just sensible.

Sleeves

Liverpool currently have a 5-year deal with Western Union as their sleeve sponsor, mainly in line with their rivals. Arsenal are currently leading the way with an £8m-a-year deal, something Liverpool should consider exceeding considerably when their current deal expires in 3 years, something for the future.

Training kits

Liverpool’s training kit is sponsored by BetVictor and their current deal expires at the end of the season, making it an opportunity to bring in a more lucrative deal. For comparison, Barcelona have reportedly the highest training kit deal (with Beko) at around £16m a year, which offers a sizeable boost in revenue should Liverpool get anyway near that figure, either by improved terms of a new sponsor.

Naming Rights

Stadium naming rights are a controversial topic in England among fans with many opposed to the idea of ruining club traditions all for the sake of a few quid. However, recent studies have shown it is no longer a few quid with valuations in excess of £10m being placed on Anfield and other famous stadiums. A boost of even £10m in commercial revenue would by over 5%.

Club Partners

Liverpool could attempt to go a different way and go for volume with sponsors. Club partners can add small multi-million-pound deals here and there however if this was scaled up, could run to the tens of millions. The main drawback here is the time it may take and the devaluing of their main sponsor who may not be best pleased to see all these deals that take the shine of their large deals.

Go Strange

What if Liverpool find the newest trend like the sleeve sponsor? This is an option for the creative. How about shorts sponsors? Press conference sponsors? These are all options and many more. The club could also develop a new medium to share their content that substantially boost their social media following and attracts more lucrative deals.

Thanks for reading – share with a Liverpool fan!

Please follow and like us:
error

Premier League 2018 Review – Wages

Premier League 2018 Wages Review

As Premier League clubs grow richer, so do the players as we saw in our revenue analysis, revenue has increased dramatically and so have wages, rising 18.5% to surpass the £2.5bn barrier.

In this new Premier League world, we have wages of £150k a week as commonplace throughout the league, not just the top 6. Wages rose by over £7.5m per week and this includes the growing wage of directors and key management as their competence off the field grows in importance.

This article analyses the wages of players and directors among Premier League clubs competing in the 2016/17 season.

Who’s Up, Who’s Down?

Premier League 2017 Wage Growth

Wages increased on average by 28.6% as the majority of clubs saw sharp increases due to increased player investment.

The promoted clubs were key contributors here with Burnley (59.4%), Middlesbrough (100.3%) and Hull (104.3%) experiencing the highest growth rates as they looked to align their wages with their newly earned Premier League riches. Interestingly, only Burnley survived despite being considerably more cautious with their wages than the other two.

Chelsea (-1.2%) and Liverpool (-0.6%) were surprisingly the only clubs to experience a fall in wages, albeit very small drops. Chelsea’s sales of high earners Oscar, Cuardrado (Loan), Ivanovic and Mikel were the main reasons for this in a season of few high-profile purchases. Liverpool similarly saw the exit of Benteke, Skrtel, Balotelli and Sakho who were all on high wages as Jurgen Klopp began his rebuild.

Tottenham saw wages grow by 26.9% as they looked to reward their players performances with new, improved contracts such as Kane, Alli and Eriksen. The purchases of Sissoko, Janssen and Wanyama supported this growth with the only high-earner to depart being Chadli.

Manchester City financial growth saw no signs of slowing down as wages grew by 33.5% as the Guardiola era began with a summer transfer spree featuring minimal departures as surplus players entered the final year or two of their high paid contracts, we expect wage growth to fall as these players depart at the end of their contracts.

Rivals Manchester United experienced a smaller rise of only 13.5% despite the high-profile purchases of Pogba and Ibrahimović due to a number of departures and the relative size of their wage bill already.

Leicester rewarded their Premier League winning squad with substantial pay rises leading to wage growth of 40% as the likes of Vardy, Mahrez and Schmeichel signed new deals which was added to by new higher profile players.

On the low side alongside Chelsea and Liverpool were Sunderland (0.6%) and Stoke (3.2%), possibly signalling they were worried about their soon to be relegations and were preparing for as much.

Premier League 2017 Wage Growth per week

In absolute terms, the average wage rise was £375k per week, or £19.5m a year. Leading the way however was Manchester City’s astronomical rise of £1.3m a week in wages after their transfer spree to introduce Guardiola to the Premier League.

Crystal Palace saw wages rise £600k a week after the introduction of Sam Allardyce who used the winter transfer window to significantly strengthen the squad with a sizeable investment, a tactic that ultimately worked as they secured survival.

Middlesbrough also experienced a £600k a week increase but were unfortunately much less successful in doing so after suffering relegation and the unenviable wage reduction strategy required. Wages are likely to fall automatically as relegation wage clauses come into effect.

Tottenham significant contract renewals contributed to wages rising by £517k a week as Harry Kane and Co became richer after another top 4 finish for the club.

Manchester United saw wages rise by £600k a week despite a relatively small % increase due to the enormous size of their wage bill to begin with.

As mentioned, on the other end of the scale is Chelsea and Liverpool who saw minimal wage drops per week of £50k and £15k, remaining relatively stable in terms of wages after offloading deadwood.

Arsenal also remained relatively stable with wages growing by £77k a week, a minimal 2% increase for the club.

Wage to Revenue Ratio

Premier League 2017 Wage Turnover ratio

A key performance indicator for all clubs, the wage: revenue ratio is key to a club in measuring financially stability and prudence. A high ratio suggests overspending, making profitability almost impossible whilst a ratio too low suggest over cautiousness and a failure maximise the use of resources. The average is 57% and most clubs will be aiming for a ratio of 50-55%.

The ratio shows a clear trade-off between risk and reward with clubs having to balance the need to grow and meet their targets and their financial future. Clubs near the bottom of the Premier League are likely to have higher ratios due to their lower revenues, however these clubs still spend an awful lot on wages due to the riches of staying in the Premier League.

Those higher up the table pay higher wages but see relatively higher revenue – which is what those spending large near the bottom are aspiring to.

Crystal Palace have the highest rate at 78.5% after their huge spending in the winter transfer window to preserve their Premier League status, a gamble that paid off but also potentially jeopardised their future, however such a gamble has enriched those at the club including senior management (more on this later).

Swansea’s was nearly as high at 77.3% due to low revenue and relatively high wages, a situation we hope they have remedied in 2018 after relegation which will cause this key ratio to increase.

Tottenham much discussed wage policy sees them achieve the lowest ratio at 41.4% as Daniel Levy continues to run a tight ship, something he is proud of considering their recent domestic performances, an increase in revenue will however help them increase their wages more in line with their rivals.

North London rivals Arsenal are 3rdon the list at 47.6%, another club who are notoriously known under Wenger to watch the purse strings, it must be something in the water up in North London!

Manchester United despite have one of the largest wage bills in world football have a wage to revenue ratio of only 45.3% due to the huge revenue they generate, showcasing that potentially player investment and huge wages leads to larger revenue, a model that Manchester City seem to have adopted in their earlier years.

Chelsea at 60.8% have the highest ratio due to providing players with historically high wages whilst also stockpiling young talent meaning they have more player wages on their books.

Liverpool (57%) and Manchester City (55.8%) complete the top 6 who all have lower than 61% ratios which is around the ball park most clubs should be.

Other than Chelsea, Crystal Palace and Swansea, the only other clubs with ratios above 60% are Everton (61.1%), Southampton (61.2%), Stoke (62.5%), Sunderland (66.8%) and Watford (60.3%), all clubs with aspirations of growing despite Sunderland and Stoke’s recent troubles.

Of the rest, Burnley’s low ratio (50.5%) should be commended due to their performances in 2017 and 2018. Outside of those already mentioned Bournemouth (52.4%), Hull (52.4%), Middlesbrough (53.5%) and West Ham (51.8%) all have ratios below 55%.

Rich Directors

Premier League 2017 Director Wages

Directors and key management staff are becoming increasingly vital to the success of football clubs with their business acumen key in driving revenue from off the field sources. The work of many executives has been praised in both the transfer market and in raising the profile of their club. A good executive can propel a financially ruined club into a viable business and footballing success.

This is apparent in the fact that directors’ salaries rose 19% to £41.5m despite not playing a minute of football, with the average salary being just under £4m, working out an average of £72k a week which is a respectable Premier League footballer wage.

However, note that director salary disclosures in the accounts may not show the full picture with some directors paid in other opaque companies and through other means which are hidden and difficult to locate so the numbers here are likely to be understated to some degree.

The highest director compensation paid was by Manchester United unsurprisingly considering their global profile and stock listing. Manchester United directors were paid £12.5m last year with this including stock options that may be more valuable than recorded currently.

Tottenham are the next closet some way behind with payments of £9m with Daniel Levy paying himself £6m as a golden pat on the back for the recent successes of the club that few would argue with despite his insistence of being more prudent than that on his players.

Arsenal also pay highly with directors being paid £3.4m despite performing poorly as of late.

Liverpool’s directors were paid relatively poorly compared to their above rivals, receiving a meagre £1.6m.

Chelsea and Manchester City had minimal values in their accounts. This may have to do with Chelsea having no CEO for the majority of the year and until the appointment of Guy Laurence. The payments for other key management were likely to not have been disclosed and as such no analysis can be performed. There is a similar story for Burnley as well.

The lowest outside of this appears to be Hull with payments of only £185k made to directors.

Also, below £1m were Leicester (£325k), Stoke (£806k), Swansea (£634k) and Watford (£571k). The most surprising club here is Leicester due to the absence of any significant rise in director payments despite the incredible season they recently had.

Crystal Palace have a notably high compensation package for directors with wages paid to directors of £2.4m, with Steve Parrish paying himself all of that as the club’s only director after the club steered clear of relegation last year, a controversial decision by the Mr. Parrish.

Wages Summary

Premier League 2017 Wages

There was £2.5bn in wages last year, an eye-watering £48.1m a week with Premier League clubs incurring an average wage bill of £125m. The Premier League Top 6 account for a huge 51% of total wages, showing their unparalleled financial power.

There was a change at the top of the wage bill chart as Manchester City’s continuing financial growth saw them shell out £264.1m in Guardiola’s first season, overtaking Manchester United who paid out £263.5m in wages.

Chelsea (£219.7m), Liverpool (£207.5m) and Arsenal (£199.4m) follow at around the £200m mark as they continue to pay players top dollar to maintain their power and clutch of world class players.

The ever-rising Tottenham lag their rivals yet again in this department, paying out ‘only’ £126.9m on wages due to Levy’s tight wage policy, a strategy that may see them struggle to keep competing with their rivals.

Burnley must be commended for their comfortable survival despite operating the lowest wage bill in the Premier League of £61.2m.

Bournemouth (£64.9m) and Hull (£61.3m) were the only other clubs with wages under £70m.

On the other end of the scale, Leicester (£112.6m), Everton (£104.7m), Crystal Palace (£111.8m) and Southampton (£112.4m) were the only clubs outside the top 6 with wages exceeding £100m.

With this all said, wages are likely to continue increasing as the amount of revenue continues to rise in the Premier League and player wage demands continue to rise and the price of relegation becomes costlier. Wages are likely to increase to around £3bn in the coming year.

Thanks for reading, share with a friend!


Please follow and like us:
error

The True Costs of Transfers

Premier League True Summer Transfer Cost

The True Costs of the Premier League 2018 Summer Transfer Window

The Premier League transfer window has officially shut with over £1.2bn spent by Premier League clubs ahead of the new season.

Clubs have to be wary of Financial Fair Play when purchasing players to avoid penalties and bans (for more on this click here) and also need to ensure they are running sustainably for their owners etc.

This brings us to this article, which will explain the true costs of transfers from the 2018 summer transfer window explained briefly below:

When clubs sign a player, from an accounting perspective this is not all charged in the year of the transfer as the payments are matched to how the player will be used. So, a player signing for £50m on a 5-year contract is deemed to cost the club £10m a year, known as the amortisation cost. This is the true costs of the transfer per season for the club.

Another key element is player sales. In this regard the profit the club gain is not simply the transfer fee received minus the transfer fee paid, it is the transfer fee received less the remaining value of the player sold. So, for a £50m player on a 5-year contract, he will be ‘worth’ £50m minus the amortisation charges to date, so after two years of charges, the player will be ‘worth’ £30m. Hence, should a player be sold 2 years later for £50m, a ‘profit’ of £20m will be recorded, rather than nothing like many people believe.

This article will analyse each Premier League club’s business and compare to their counterparts.

Due to the availability of data, this excludes the costs of loans and player wages. All transfer fees and contract lengths are via Transfmartk.co.uk. In order to simplify the amortisation costs, we have ignored contract renewals which make the calculation more complex without much added insight.

Let’s Not Talk About Spend, Let’s Talk About Net Spend

Premier League Transfer Net Spend

Premier League clubs had an active transfer window despite its shortening, spending over £1.2bn, receiving only £353m in return, leaving the club with an astronomical net spend of £909m.

This was due to higher spending by certain clubs, with Liverpool leading the way by a distant after investing heavily following their Champions League heartache with Naby Keita, Fabinho, Alisson and Shaqiri joining while only Danny Ward left, leaving the merseysiders with a net spend of £151m.

Fulham became the first promoted club to ever break the £100m barrier after a barnstorming transfer window with 7 players arriving for transfer fees and only 1 leaving. This led to the club having a net transfer spend of £101m with Seri the pick of the players signed.

Fellow West Londoners Chelsea had the third biggest net spend at £92m after breaking the world transfer record for a goalkeeper in the £72m paid for Kepa after losing Courtois to Real Madrid and they also signed Jorginho.

Manchester United and Manchester City had quiet windows with both making one big purchase a piece with Fred joining United (along with Dalot and Grant) and Mahrez joining City.

At the other end of the scale were Watford with a net transfer spend of minus £23m after not reinvesting all of their Richarlison windfall. Newcastle also were in the black after recording a net transfer spend of minus £13m as Mike Ashley used transfer cash received to purchase House of Fraser rather than reinvest in the Toon.

Additional Amortisation Costs

Premier League Amortisation Costs

Premier League clubs face additional transfer costs of £275m this year alone after a huge transfer spend of over £1.2bn, with this cost spread of the players signed contracts which average at just over 4-year contracts.

Amortisation costs are, as explained above, based on transfer spend and contract lengths and as such the costs are higher for larger spends and also higher when contract lengths are shorter. A key example is Kepa, a £72m keeper who signed a 7-year contract, costing Chelsea just over £10m a year. While Mahrez, a £61m purchase on a 5-year contract cost Manchester City more at just over £12m a year despite the smaller transfer fee.

Liverpool unsurprisingly lead the way after their impressive transfer window where they spent £164m with Alisson signing a 6-year contract while Keita, Fabinho and Shaqiri signed 5-year deals. Liverpool will have additional costs of £31m after these deals.

Fulham had the second highest net spend after their £105m 7 player splurge with contracts lengths 4 years on average, bringing amortisation costs of £24m over that period.

Leicester despite their relatively small net spend have a large transfer costs due to their £103m spend with the Mahrez deal diluting their net spend after the club reinvested the Mahrez cash and then some, leading to an amortisation cost of £22m.

Chelsea and West Ham also had large amortisation costs above £20m after their productive transfer windows.

Tottenham were at the other end of scale after an inactive transfer window, becoming the first club since the transfer window came into effect in 2003 not to purchase or sell a player.

Crystal Palace were the only other club to have an additional amortisation cost below £5m.

Amortisation Costs Savings

Premier League Amortisation Savings

Premier League clubs saved £41m on amortisation cost after after player sales of £353m with many players sold either brought cheaply or have been long serving players that no longer attract amortisation costs after staying longer than their original contract.

Amortisation costs savings are driven again by the transfer fee paid when the player was brought and their original contract length. So, for instance Daley Blind signed for Manchester United 4 years ago for £15.8m on a 4-year contract, costing Manchester United just under £4m a year for those 4 years. Now that the 4 years are up, Blind costs United nothing from an accounting perspective, so no amortisation costs are saved and hence no savings included in our calculations.

As such many Premier League clubs didn’t recorded any savings as the players sold had already seen their entire transfer fee amortised. This includes players signed as youths such as Danny Ward at Liverpool or long serving players such as Courtois at Chelsea.

In a couple of situations, players were signed and immediately sold. This was the case for Benik Afobe at Wolves and Mikel Merino for Newcastle. In both these cases the amortisation costs were excluded when calculating additional costs and savings.

Bournemouth were the biggest savers, saving just under £8m after the sales of the after mentioned Benik Afobe to Wolves (before Wolves later sold him to Stoke), Lewis Grabban and Max Gradel.

Everton (£7m), Newcastle (£6m) and Watford (£5.5m) were the only other clubs to save in excess of £5m on player sales after the sales of the likes of Klassen, Mitrovic and Richarlison.

Burnley, Cardiff, Crystal Palace and Tottenham sold no players hence the reason for their lack of amortisation costs savings.

Chelsea, Liverpool, Manchester United, Southampton and West Ham also had no amortisation costs savings despite player sales due to the players sold having been at the club for at least their original contract lengths such as Courtois, Danny Ward, Blind, Tadic and Kouyate.

Profit, Profit, Profit (Or Loss)

Premier League Transfer Profit

Premier League clubs due to this made profits on their sales of £247m after selling players for £353m, a 70% return on investment.

When players are sold, as seen above, this may not lead to amortisation costs savings if the players amortisation costs were low due to the price paid or they have been at the club a long time.

This doesn’t mean they receive nothing, as the amount earned is recorded as a profit on player sales. This is recorded as the transfer fee received minus their remaining value as explained in the introduction. However, to avoid you having to scroll up, here is an example from this season using Courtois.

Courtois cost Chelsea £8m 7 years ago on a 5-year contract, costing the club £1.6m a year initially. Each year he is worth less of his transfer fee, so after 1 year he is worth £6.4m and after 2 years £4.8m etc. After 5 years he is worth essentially zero, at this point when he is sold the transfer fee received is all profit, so Chelsea record a profit of £31.5m.

Clearly the biggest benefiters here were Leicester after their sale of Mahrez was essentially all profit and hence the club recorded a profit of £67.1m.

Chelsea also benefited as described above, whilst Watford were the only other club to record a profit of more than £30m after their sale of Richarlison.

Everton were one of only two clubs to make a loss after the costly purchases of Klassen and Funes Mori who they both made a loss on after buying them recently and then selling on the cheap. Leading to a loss of £3.8m.

Arsenal also made a loss on the flop transfer of Lucas Perez, diluted slightly by the sale of academy graduate Akpom.

Burnley, Cardiff, Crystal Palace and Tottenham made no transfer sales and hence recorded no profit or loss this year.

The Summary – The True Cost

Premier League True Transfer Cost

To work out the true cost of this transfer window we use the following formula:

Additional amortisation costs – Amortisation costs saved -/+ Profit/Loss on player sales.

This gives an interesting picture for Premier League clubs with a net transfer costs of minus £13.9m! Meaning Premier League clubs as a whole have saved on transfers this year from a Financial Fair Play perspective.

This is heavily skewed due to the net savings made by Leicester, Watford and Newcastle in particular.

Leicester, due to the Mahrez deal have made a saving of approximately £50m after their new signings, while Watford and Newcastle have also saved in excess of £20m.

Both Manchester clubs are in the black after making one big purchase each and selling a couple fringe players.

Chelsea are also in the black after selling Courtois.

Fulham have the highest cost of £20m after their sensation transfer window in which they spent hugely for a Premier League newcomer, making a statement on their ambitions.

Liverpool were unsurprisingly up there with a net cost of £18m. Everton and Arsenal were the only other clubs with a net cost exceeding £15m.

To put this all into perspective there is a mismatch. The profits received are all given in the period of sale, while new transfers are spread over their contract. This means that Chelsea, despite making a profit on Courtois, and hence their net costs are negative, will indeed see amortisation costs rise in the long run as next year they will not have that Courtois profit.

The same is the case for amortisation costs saved, for some of the players sold, they may only have had one more year of amortisation costs and as such this saving will not be there next year and hence they will see amortisation costs rise the following year.

Amortisation costs have risen over the years and will continue to as long as clubs net spends are still as large as they are.

I hope you found this article insightful, share with a friend!

Please follow and like us:
error

Premier League Financial Review – Summary

Premier League Financial Review 2018

Here is your summary of Premier League financial performance for all Premier League clubs in 2018. As financial accounts are released one year in arrears, finances are based on 2017 season performance. In depth summaries of these finances are available by clicking the club’s name or the infographic.

Arsenal – Wenger’s Wonga

Arsenal Financial Review 2018

Bournemouth – Finances With a Cherry on Top

Bournemouth Financial Review 2018

Burnley – Marking Their Turf 

Burnley Financial Review 2018

Chelsea – Riches of Champions

Chelsea Financial Review 2018

Crystal Palace – The Price Of Survival

Crystal Palace Financial Review 2018

Everton – Stuck Toffees 

Everton Financial Review 2018

Hull – Tigers Timid Roar

Hull City Financial Review 2018

Leicester – Foxes’ Fortunes

Leicester Financial Review 2018

Liverpool – Top 4, Top Finances

Liverpool FC Financial Review 2017

Manchester City – Sky’s The Limit

Manchester City Financial Review 2018

Manchester United – No Top 4, No Problem

Manchester United Financial Review 2018

Middlesbrough – Down The River

Middlesbrough Financial Review 2018

Southampton – Saints Keep Marching On

Southampton Financial Review 2018

Stoke – Cold, Wet and Windy But Safe

Stoke Financial Review 2018

Sunderland – Out of Lives

Swansea – Survival Swans

Swansea Financial Review 2018

Tottenham – White Cash Lane

Watford – Honest Hornets

Watford Financial Review 2018

West Brom –  Unusual Addicks

West Brom Financial Review 2018

West Ham – Ambitious Hammers

West Ham Financial Review 2018

Please follow and like us:
error

Tottenham Financial Review 2018

Tottenham enjoyed another fine season of progression, finishing second in the league, finishing above Arsenal for the first time in many years in the progress.

The season was not without its disappointments, crashing out at the group stages of the Champions League after failing to come to grips with playing at Wembley for their ‘home’ games’, while also missing out on FA Cup glory after the anguish of a semi-final exit.

Off the pitch the club continues to impress with growth in key areas leading to an increase in profits from £33.0m to £41.2m (24.8%), netting Chairman Daniel Levy a sizeable increase in his salary.

Tottenham Profit:Loss

Revenue Analysis

Tottenham Revenue

Revenue rose to record levels, breaking the £300m barrier. Revenue increased from £209.8m to £306.3m (31.5%) with revenue increasing in all areas of the club.

Matchday revenue rose from £40.8m to £45.3m (11%) due to the added bonus of playing Champions League games at the 90,000 seater Wembley Stadium, this plus a fine FA Cup run increased matchday takings despite the closure of the North East corner of White Hart Lane, reducing capacity and match earnings for Premier League games.

Broadcasting revenue rose remarkably, increasing from £110.4m to £188.2m (70.5%), with Champions League revenue bringing in £44.6m despite their early exit. This combined with the huge new Premier League TV deal, in a season they finished second, has increased broadcasting revenue considerably. Tottenham also gained £5m in prize money from their domestic cup performances.

Commercial revenue also rose impressively, increasing from £58.6m to £72.8m (24.2%) as the club’s global popularity continues to rise, with sponsorship revenue accounting for £57.4m of this revenue while merchandise sales accounted for £14m.

Tottenham will expect revenue to continue to rise to match the continued improvements shown by their side. Progression slightly further into Champions League will enhance broadcasting revenue, offsetting any loss from a slightly lower finish in the Premier League. Commercial revenue is likely to continue rising as the shrewd Daniel Levy continues to impress with his business acumen.

Also, with the club playing a full season at the 90,000 Wembley Stadium, matchday revenue will rise significantly due to the increased capacity although this rise is likely to be temporary as they will experience a 30,000 drop in seats when they settle at New White Hart Lane next season.

Expenses Analysis

Tottenham Operating expenses

As the club continues to grow, so are their expenses, rising from £194.2m to £276.7m (42.5%) on the back of their player and stadium investments.

Depreciation on their assets rose hugely, increasing from £6.4m to £32.8m, an increase of over 5 folds. This has to do with the accounting treatment around their new stadium build.

Along with this, player amortisation costs also rose significantly from £31.5m to £42.9m (36.2%) on the back of player investment over the year.

Tottenham Wages

Wages rose considerably too, increasing from £100.0m to £126.9m (26.9%) on the back of player pay rises and new signings. Contributing to this figure was Daniel Levy who has more than doubled his pay from £2.8m to a cool £6m after another stellar year of growth. This won’t however stop players, agents and fans questioning the large rise which works out at £115k a week for a club with tight wage controls. 

The increase in wages works out at an eye-watering extra £517k a week. 

Finance costs rose significantly on the back of new financing, increasing from £4.2m to £11.7m (179%) which will be a concern if these continue to rise and the club have to tighten their purse strings.

Tottenham had a sizeable tax bill, paying £16.7m in tax working out a high effective tax rate of 28.8% compared to the actual tax rate of 19% – this is due to certain costs (such as the hugely increased deprecation costs) not being deductible for tax purposes.

Transfer Analysis

Tottenham Net Transfer Spend

Tottenham had a rather modest transfer spending compared to what their league position suggested.

In came Sissoko (£31.5m), Janssen (£19.9m), Wanyama (£13.0m), N’Koudou (£9.9m) and Lopez on loan (£1m) for a combined £75.2m.

Out went Mason (£13.9m), Chadli (£13.7m), Pritchard (£8.5m), Yedlin (£5.3m), Carroll (£4.7m) and Fazio on loan (£1.1m) for a combined £47.1m.

This worked out at a relatively low net spend of £28.1m compared to net income of £14.9m last season. 

Of Tottenham’s signings, only Wanyama impressed with Janssen and Sissoko subject to particular  ridicule by rival fans. This failed to derail Tottenham’s domestic campaign with their existing stars pulling the club forward, however the lack of quality depth may have cost the club in the cups.

Tottenham made a profit on player disposals of £40m, up 47.6% on last years total.

Tottenham paid £61.7m in cash for players this season, receiving £67.5m due to previous sales just being paid now.

Assets/Liabilities Analysis

Tottenham Net Debt

Tottenham are starting to see the effects of financing a new stadium already with their current net cash position diminishing despite cash reserves increased significantly from £172.6m to £200.1m (15.9%). Tottenham’s increased profits helped to boost cash levels whilst significant cash received from transfers as mentioned and new loans of £157.6m (despite repayments of £102.0m). contributed to this figure.

Debt levels rose a great deal also with those new loans that came in, increasing from £125.0m to £185.5m (48.4%) with bank loans making up most of this increase as mentioned above.

This led to their net cash position falling, decreasing from £47.6m to £14.6m, a huge 69.3% deterioration which is a sign of things to come as financing a new stadium comes at a significant cost.

Tottenham can look forward to potentially pocketing £43.8m in future transfer fees if ex players meet certain clauses while they only have £11.5m payable for such clauses on their current players.

Thanks for reading, share with a Tottenham fan!

Please follow and like us:
error

You’ve Been Sponsored

You've been sponsored

Sponsorship revenue is a major source of income for premier league clubs and has been increasing year on year. Commercially vital to clubs, major sponsorships provide revenue of a long period due to the contracts usually being over a few years. This year club sponsorships brought in £282 million in revenue for premier league clubs before taking into the various partnerships they also delve into. This article will will go into detail about the types of industries that are attracted to invest and sponsor football clubs. We will also look at kit manufacturers and the role they play in football finance.

Football sponsorship has changed immensely over the years. Looking at the last 11 years (2007 – 2017), Beer has diminished as a large purchaser of sponsorships with no current club having a beer manufacturer as a sponsor. Betting companies have dominated as of late with a high of 9 companies donning sponsorship deals in 2016/17 season, nearly half of all clubs. This makes perfect sense being that football fans represent a key audience for betting companies. Interestingly, this space is not dominated by the largest, most well-known betting companies (other than Bet365 and BetWay), rather overseas and casino gambling companies being the most keen sponsors. It would be interesting to see if the likes of Paddy Power and Ladbrokes decide to enter this space in the future.

Premier League Sponsorship Companies

Financial services companies are aiming to fill the gap left since Barclays no longer sponsor the Premier League. Banks, Insurance and pay-day loans companies are all present here and the financial sector has been ever present in the sponsoring premier league clubs, with at least 3 on average in each of age last 11 years.

Airlines are another major part of the football clubs with two of the largest clubs, Arsenal and Manchester City representing the industry. Both have long standing partnerships with their respective airline.

Other industries to have sponsored Premier League clubs over the years include Sports fashion, Charities, Automobiles and confusingly a Zoo!

Premier League Shirt Sponsorship

As mentioned, sponsorships are a huge source of cash for the clubs with over £282m coming from shirt sponsors alone. Above we have the league table of shirt sponsors. It has a very familiar look to it, with domination from the top 6 who take home over 75% of sponsorship revenue. Man United show their dominance as the most reputable club in English football if not the world, with their Chevrolet deal bring them a handsome £47m a year. While newly promoted Huddersfield and Brighton at the foot of the table with deals of £1.5m each, more than 30 times less than Manchester United.

West Ham can be pleased at being 7th with their BetWay sponsorship bring in £10m a year, this is due to run until the end of this season and they will be hoping a strong showing in the league this season can lead to a similar, if not larger deal especially with the attraction of such of large stadium and tourist attraction for prospective sponsors.

Leicester have a long term agreement with shirt and stadium sponsor King Power and have yet to really cash in their title heroics through this commercial medium.

Interestingly, all London clubs are in the top half of the table, suggesting their is a preference among sponsors to pay a premium to sponsor London clubs, with Crystal Palace above the likes of Newcastle, Leicester, West Brom and Southampton.

Please Stay!

In terms of turnover of club sponsorships, only Tottenham of the Premier League ever-presents has had more than 2 sponsorships, with 6 in the 11 years analysed. Only Arsenal however have not changed sponsors during this  period, however most of these changes were after a long period with that sponsor and we suspect their current deals to continue for the foreseeable future. West Brom have a record high of 7 sponsors in 9 years (including 1 year with none), this is interesting as to whether this indicates poor commercial success or just a policy of renewal. This doesn’t seem to be working with their current deal the 4th worst in the league ahead of only newly-promoted Brighton and Huddersfield, and Burnley.

Kitted Out

Premier League Kit Deals

Kit manufacturer income is another major source of sponsorship income, many large sport brands pay millions to create kits for clubs, profiting from the sales of these. The largest two manufactures are the most well known sports brand in the world, Adidas and Nike. Adidas have seen a huge decline however since their high of 9 kits in 2013 to only 3 in 2017, even losing Chelsea who cut their sponsorship short to sign for Nike last season, paying £67m in the process. The spread of sport companies has diversified in recent years with none dominating as was the case with Adidas, Nike and Umbro in previous years. Umbro were previously a huge producer of kits, making 6 kits in 2007, the largest at that time to none in 2013 before renewing their presence recently with 3 currently rocking the diamond on their kits.

It will be interesting to see how Adidas react to their recent fall, they may decide to attract a large club such as Arsenal to their ranks after missing out on Manchester City who have agreed a deal with Puma for next season.

Speaking of Puma, they lead the way this year for clubs wearing their brand, which has been on a steady increasing trend since 2007.

Premier League Kit Deal Income

There is the usual pattern for Kit makers as there is in performance in domestic leagues, the top 6 dominate due to their domestic success and the large fan bases that come with that. The top 6 take home a remarkable 89% of income generated from kit manufacturers.

Surprisingly, Manchester City lag their domestic rivals significantly in the value of their deal with Nike, coming in at only £12m a year compared to the £75m Adidas deal of their Manchester rival or £60m a year deal of Chelsea who also have their kits made by Nike, something that will be rectified once Puma take over in the summer in a £50m a year deal.

Data was unavailable for Huddersfield and Brighton, however we suspect their deals to be around the £1m mark, maybe lower than Bournemouth who are bottom with an £800k annual deal.

Sleeves of Gold

A new phenomenon among premier league clubs is the introduction of sleeve sponsorships, with 17 out of the 20 premier league teams (Arsenal, Manchester United and Tottenham are yet to have one). This has brought in on average £3m a year extra revenue to premier league clubs, for example Liverpool Western Union deal has brought in £5m a year to the clubs coffers. Chelsea have the largest sleeve sponsor deal to date, with an extra £8m year brought in, while at the other end of the scale Huddersfield only bring in £300k in extra revenue from their sleeves.

Premier League Sleeve Sponsors

I hope you enjoyed this article, please share and like us on Facebook and Twitter.

Please follow and like us:
error

Matchday Money – Gameweek 20

Matchday Money Gameweek 20

Welcome to the first in a new series where we estimate the matchday gate receipts taken at all premier league games each week. We will compare the revenue generated between teams and compare their strategy for maximising matchday revenue.

The revenue is calculated based on an average of the highest and lowest prices offered to club members for each match. This amount is then multiplied by the number of tickets available for sale which for home teams is attendance less away ticket allocation and season tickets sold. Away teams is simply the away ticket allocation multiplied by the away ticket price. A separate article will analyse the season ticket revenue taken by each club.

The away allocation differs from game to game with it up to negotiation between the clubs. The lower of 10% of stadium capacity or 3,000 seats must be offered to away teams on each matchday, however this is not always taken up as clubs analyse the demand for the game among their fans and choose accordingly.

Here are the matchday results for gameweek 20:

Bournemouth 3 – 3 West Ham

Chelsea 2 – 0 Brighton

Crystal Palace 2 – 3 Arsenal

Huddersfield 1 – 1 Stoke

Liverpool 5 – 0 Swansea

Manchester United 2 – 2 Burnley

Newcastle 0 – 1 Manchester City

Tottenham 5 – 2 Southampton

Watford 2 – 1 Leicester

West Brom 0 – 0 Everton

Gameweek 20 Analysis

Premier League Matchday 19 Stadium Attendance

Chelsea led the way in stadium capacity percentage with 99.8% of the stadium filled as 41,568 fans flocked to their boxing day fixture, closely followed by Newcastle fans who watched their team play league leaders Manchester City. Unsurprisingly, Manchester United’s attendance of 75,046 was the highest by a distance with Tottenham second nearly 20,000 behind despite a stadium capacity percentage of 61.6% in their temporary 90,000 seater home.

Premier League Gameweek 19 Matchday Revenue

Despite their lowly stadium capacity %, Tottenham led the way with gate receipts with takings of over £1.3m, in part due to their high ticket prices of £55 and the fact they only sold 28,000 season tickets for Wembley, meaning a more matchday tickets on sale equating to a higher taking each matchday.

Premier League Matchday 19 Home Revenue

Liverpool’s season ticket sales of 25,000 also allow them to benefit from more expensive matchday tickets. Manchester United and Chelsea complete the top 4 this week with Manchester United’s lower due to the 55,000 season tickets sold. These amounts are more secure, so there is always a trade off between the guaranteed selling of season tickets and the potential for empty seats on matchday.

Bournemouth’s 11,360 seat stadium, combined with season ticket sales of 7,000 mean their takings from games are low, something they will be hoping to rectify after stabilising in the Premier League.

Premier League Matchday 19 Away Revenue

For away teams the revenue is usually fairly balanced, with the away allocation always fairly similar. All premier league teams agreed to cap away ticket prices to £30, with Arsenal even taking it a step further at £26. Southampton playing away to spurs were allocated the full 3,000 meaning they lead the way in away matchday revenue, followed closely by Brighton, Burnley Manchester City and Swansea – who all played teams with stadium capita of over 45,000. West Ham lag the rest by far, playing at the smallest stadium in the top flight by far, Bournemouth’s Vitality Stadium which boasts 11,360 seats. West Ham were only given an allocation of 2,000 seats.

Thats it for the first week of this matchday money series – any feedback would be greatly appreciated as we continue to refine the formula to get as accurate a read on matchday takings.

Please follow and like us:
error

Puma Pounce to Sign Manchester City

Manchester City Puma Deal

Manchester City have agreed a huge £50m a year deal to replace current kit supplier Nike with Puma. The new deal represents another commercial win for the Premier League leaders, dwarfing their current £20m-a-year deal with Nike agreed in 2012. The Nike deal expires at the end of the current season and Manchester City have moved quickly to exploit their growing global presence after a strong start to the season.

The deal represents a coup for Puma who continue their dominance of premier league kit deals, with Manchester City being the 6th club to don the Puma logo, with Arsenal being the other big team as well as Newcastle, Leicester, Burnley and Huddersfield. This means that next season, Puma will potentially spend more than £85m on sponsoring current premier league clubs, unless Arsenal decide to leave …

Kit Sponsor's Premier LeagueKit Sponsor's Premier League

Talking of Arsenal the deal will be of some annoyance, as their own Puma deal is at £20m significantly less. However there is substantial rumours of a deal set to be agreed with Adidas that will bring them in line with their title rivals. Liverpool and Tottenham will also want to renegotiate deals to avoid falling behind in commercial terms to their rivals.

The deal also means that the Premier league top 6 represent around 90% of the kit deal revenue brought into the league, further showcasing the gulf in spending power available. It makes sense for kit manufacturers such as Puma and Nike to invest in clubs like Manchester City due to their global nature and growing fan base, something smaller clubs cannot offer and as such, won’t bring in the kit sales that would make a larger investment profitable.

Kit sponsorship premier league

The deal shows the continued commercial awareness of Manchester City as they build on their early season success. Guardiola’s attractive brand of football is making the team great to watch and as such, attracts global brands to invest in them to build and maintain their own global presence.

It will be interesting to see where Nike go next, with only Chelsea and Tottenham being sponsored by them currently, they may look to Arsenal, Liverpool as potential sponsorship opportunities should they look to build their revenue to be in line with the deals of Manchester United, Chelsea and most recently, Manchester City.

Kit manufacturers in premier league

Please follow and like us:
error