Hull City’s 2019 Finances – Parachute Profits

Hull City FC's 2019 Finances

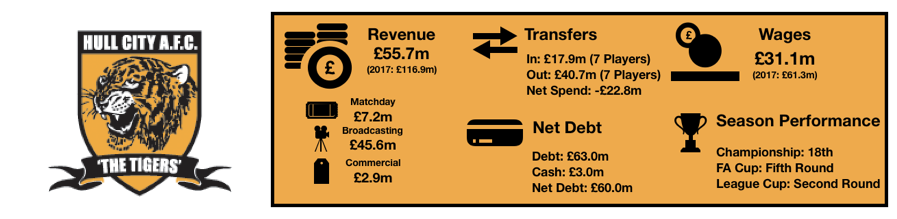
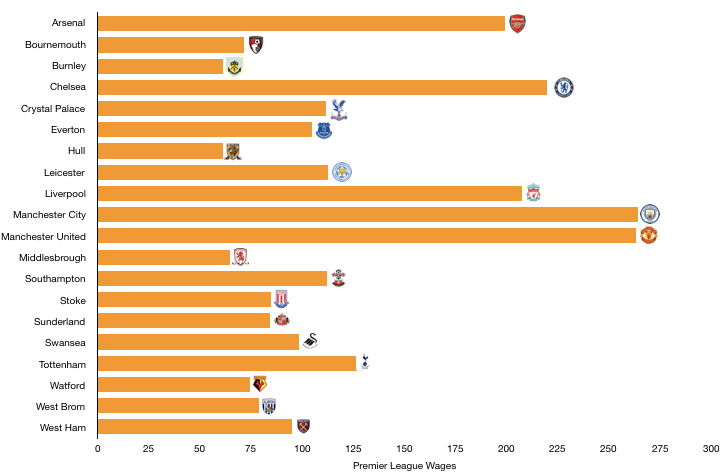
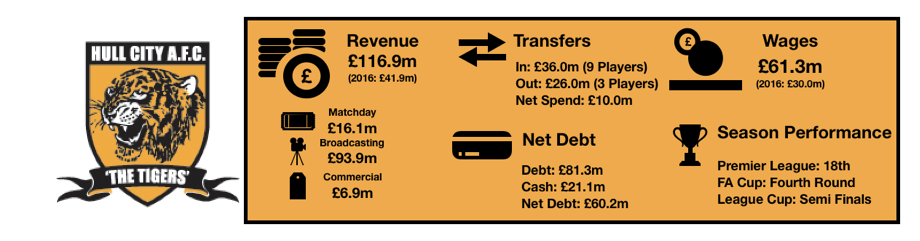
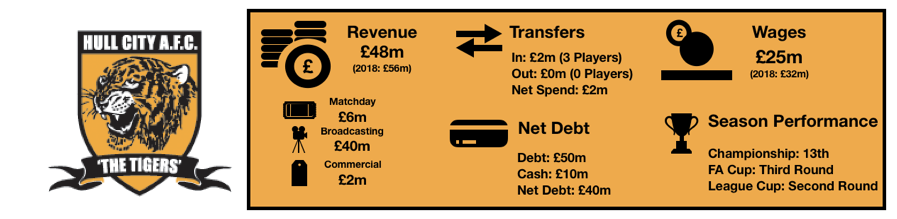
Hull endured a second successive season in the Championship following relegation from the Premier League in 2017.

It was an underwhelming season once again for the Tigers, who finished mid table in 13th, improving on the previous season’s 18thplaced finish.

A poor end to the season for Nigel Adkins’ side spelled the end of a late play-off push, something the club will be hoping to amend in the coming season under new boss Grant McCann.

Financially, Hull remain one of the few profitable Championship clubs due to the benefit of parachute payments following relegation and a number of player sales in the 2018 season. Despite the financial boost these gave, their reduction and the lack of player sales in 2019 have seen Hull’s profit after tax fall from £19m to £3m (84%), showing a significant downward trend in profits.

Let’s delve into the numbers.

Hull City Profit:Loss 2019

Revenue Analysis

Hull City 2019 Revenue

Despite an improved domestic campaign, Hull saw underlying revenue (excluding payments) fall from £12.3m to £11.2m (9%). When taking into account parachute payments the drop is far greater, falling from £55m to £48m (13%).

This was primarily due to a fall in match day revenue of £1m from £7.2m to £6.2m (14%) as average attendances fell from 15,622 to 12,165 (22%) as fan goodwill faded following a poor season. Hull also benefited in 2018 from a run to the FA Cup Fifth Round, featuring a lucrative trip to Stamford Bridge.

Broadcasting revenue increased, rising from £2.3m to £2.7m (17%) after Hull finished 5 places higher in the Championship last season. This is despite exiting the FA Cup at an earlier stage.

Parachute payments began to taper off following a prolonged stay in the Championship, falling from £43m to £37m (14%). These parachute payments will continue to decline over the next two seasons before ceasing, meaning Hull may have to prioritise a return to the Premier League or face worsening finances.

Hull suffered from a second successive season in the Championship commercially, with commercial revenue falling from £2.8m to £2.2m (21%). Should Hull fail once again to gain promotion (or challenge), commercial revenue may fall below £2m.

Looking ahead, revenue is very likely to fall in the 19/20 season due to another drop in parachute payments. Even if promotion is secured, in the short run (next year), Premier League income would lag a season behind the fall in parachute payments and therefore revenue is likely to deteriorate further.

Costs Analysis

Hull City costs 2019

Hull have undergone cost control in order to safeguard their finances, with revenue falling year on year following relegation. Total costs fell from £60m to £49m (18%), a greater fall than revenue, improving underlying profitability.

Amortisation remained relatively stable, increasing from £12.3m to £13.0m (6%) after minimal player investment (just over £2m was spent in the season – see transfers analysis section).

Interest costs fell from £3.1m to £2.4m (23%) after a decrease in the debt owed by the club (see debt analysis section).

Hull City Wages 2019

In a bid to remain profitable, Hull adopted strict wage controls to reduce their wage bill. Wages fell from £31m to £25m (19%), greater than the fall in revenue (13%), essentially improving underlying profitability despite the figures not showing such.

A host of high-earners such as Meyler, Larsson and Hernandez were released, freeing up wages for new signings while also reducing the overall wage bill.

Hull were also taxed £424k, an effective tax rate of 14%, below the actual tax rate of 19%.

Looking ahead, Hull were fairly inactive in the 2019 summer transfer window and as such wages and amortisation (two of the largest costs) are likely to remain fairly stable, with a slight increase being expected to overall costs.

Transfers Analysis

Hull City Net Transfer Spend 2019

Hull saw a significant pool of players depart on free transfers in 2018/19 with little in the way of transfer fees with no departures (for fees) and only 3 signings (for fees).

In came Burke (£1.5m), De Wijs (£0.4m) and Milinkovic (£0.3m) for a combined £2.2m.

The signings all performed as expected with none really disappointing in their first season with the onus now being on them to kick on.

The lack of player sales compared to the exodus following relegation helped stabilise the team on the pitch and it showed. However, without such sales, Hull saw their profit on player sales fall from £31m to £5m (83%). (Despite no player sales in 2018/19, contingent transfer fees would’ve have been activated hence the £5m profit).

In cash terms, Hull spent £1.9m on new players and received £4.6m, a net cash inflow of £2.7m.

Hull are also owed £5.5m in transfer fees, although this is significantly down on last year’s £20m (which has boosted cash reserves – see debt analysis).

However, Hull do themselves owe £2.5m in transfer fees in the next year, which is more than covered by the amounts owed to them so shouldn’t be a financial worry.

In terms of contingent fees, Hull could be liable to make payments of £6.6m depending on palter appearances etc. Fortunately, Hull could also be due £7.3m should players previously sold meet certain clauses.

Debt Analysis

Hull City Net Debt 2019

Hull are fairly cash-rich compared to their peers, with cash reserves increasing from £3m to £10m (233%) in their second Championship season. This was due to their ability to reduce costs by more than the fall in revenue and also due to the net transfer income they received.

This allowed Hull to repay £13m in loans, ensuring the club are more sustainable going forward.

As mentioned above, Hull have begun attempting to reduce the debt owed by the club to their owner, Mr Allam. Debt fell from £63m to £50m (21%) after the repayment mentioned above, which also reduced interest costs.

Hence net debt has fallen from £60m to £40m (33%).

Going forward, Hull will need to be careful to manage the balance between their ambitions and finances to ensure compliance with Financial Fair Play in a period where many EFL clubs are at risk of falling foul of the measures.

Hull have prudently managed their finances since relegation, recording profits in both periods, although this will become increasingly difficult as parachute payments fall and unless the club make any significant player sales. However, due to profits of £22m over the past two years, Hull should be fairly secure from any FFP troubles for the next couple of seasons at least, plenty of time to attempt to secure promotion back to the Premier League.

Thanks for reading – Please Share!

Please follow and like us:
error

Hull 2018 Financial Review – The Cost of Relegation

Hull City Financial Review 2017:18

Hull are back in the Championship after a disappointing Premier League return saw the club relegated after an 18thplaced finish in the Premier League, a position they would achieve again in the Championship after a poor return to the division.

A decent FA Cup run to the Fifth Round was a brief highlight as the club struggled to reacclimatise to life in the Championship. Such a poor season has seen expectations diluted with the owners seemingly unwilling to spend big in order to achieve promotion.

Relegation halved revenues however costs  also fell by a similar level meaning the club still remained very profitable, achieving a profit of £19.3m which was still a drop from last year’s record-breaking £34.8m profit.

Hull Profit:Loss 2018

Let’s delve into the numbers.

Revenue Analysis

Hull Revenue 2018

Hull were braced for a steep drop in revenue after relegation with 80% of their revenue coming from broadcasting revenue. This meant revenue more than halved from £116.9m to £55.7m (52.4). All areas of revenue more than halved for Hull as they saw first-hand the cost of relegation.

Broadcasting revenue has already been eluded to as the main cause of this huge drop, more than halving from £93.9m to £45.6m (51.4%) as the club saw significantly reduced TV payments, even with the parachute payments received. This figure will continue to drop as parachute payments drop unless Hull navigate a quick return to the Premier League.

Matchday income also fell significantly, falling from £16.1m to £7.2m (55.3%) as the lack of Premier League worthy opponents saw a fall in ticket prices and sales. Fans want value and the fall in value is clear to see with the lack of games against the likes of Manchester City, Manchester United and Liverpool.

A common theme is concluded by the huge drop in commercial income as it more than halved from £6.9m to £2.9m (58.0%) as sponsors ran away after Hull lost their Premier League status with the fall in brand exposure to companies large when not featuring on TV as much and even when they are, to a much smaller audience.

Hull will expect revenue to fall again next year as parachute payments fall. This could be balanced by an improved league position and improved domestic cup performances however matchday income is unlikely to rise significantly without vast improvements on the pitch and the same can be said of commercial income. We expect revenue to fall closer to the £45m mark.

Expense Analysis

Hull Operating costs 2018

As revenue halved, Hull had to reduce expenses significantly to avoid incurring huge losses. Hull were successful in doing this as expenses fell from £107.5m to £60.3m (43.9%).

Amortisation costs fell dramatically from £32.6m to £12.3m (62.3%) as the club sold a few of their star players who were brought only a year or two earlier. This shows the true costs of their transfers as they saved costs on recent signings by necessity and also by force as players forced through moves to remain in the Premier League.

Hull also spent £760k leasing the KC Stadium, a £70k rise in costs in this area.

The club saw adverse movements on their foreign exchange hedges and operations as they lost £761k on these movements as the pound weakened.

Hull saw a decrease in interest costs, falling from £4.3m to £3.1 (27.9%) as the club paid off bank loans early and took on more owner debt (more on this later).

After another profitable year and no losses to offset profits against, Hull have begun paying a lot of tax, incurring UK tax of £4.4m this year. This works out at an effective tax rate of 18.6% which is essentially in line with the UK corporation tax rate of 19% after a few tax adjustments.

Hull Wages 2018

Hull would have had relegation wage drop clauses within the majority of player contracts and this has led to wages pretty much halving from £61.3m to £31.1m (49.3%) as player wages dropped due to clauses and the club also selling a few high earners.

Wages dropped by a substantial £30.2m, a huge £581k a week fall in wages. Interestingly, they are more or less back to same levels of their last Championship season where wages were £30m.

Hull will now look to carefully manage costs as they plot a strategy for returning to the Premier League or remaining profitable as a well-run Championship club. Wages are likely to remain at a similar level next year to now, either decreasing or increasing by a relatively small amount of no more than 10%.

Transfers Analysis

Hull Net Transfer Spend 2018

Hull saw a huge squad overhaul in the summer as they braced themselves for life back in the Championship, with many high earners and star players departing meaning replacements were required.

In came Stewart (£4.1m), Dicko (£3.4m), Toral (£3.0m), Kingsley (£3.0m), Irvine (£1.9m), Mazuch (£1.8m) and MacDonald (£0.7m) for a combined £17.9m.

Departing the KC Stadium were Clucas (£14.7m), Maguire (£12.3m), Robertson (£8.1m), Jakupovic (£2.1m), Huddlestone (£2.0m), Elmohammady (£1.0m) and Davies (£0.5m) for a huge combined £40.7m.

This meant Hull had a net transfer income of £22.8m as they sold a raft of players that impressed in the Premier League and decided not to reinvest this in its entirety and gamble on an immediate return to the Premier League.

The new signings obviously struggled as indicated by the poor league position achieved however this wasn’t helped by managerial change and a lack of clarity.

The players sold all impressed at their new clubs, especially Maguire and Robertson and were sorely missed by Hull last season.

Hull spent cash in the year on transfers of £16.9m compared to £32.4m last year. They also brought in cash of £31.3m compared to £33.3m after the significant sales of last season began to pay the cash they owed. This interestingly shows that Hull brought in more cash on players then they spent yet again as the owners continue to show a cautious approach to Hull’s finances.

Hull made a huge profit on player disposals for the second year in a row as this figure rose from £29.9m to £30.9m (3.3%) after the transfers of Clucas, Maguire and Robertson.

Hull are owed a further £20m in player transfer fees which will boost cash and club finances with £10.5m of that amount owed within the next year.

In comparison, Hull owe other clubs £7.5m in transfer fees with £5.8m owed within the next year.

Hull also have potential contingent transfer fees payable of £1.1m whilst they could be owed a further £8.7m in contingent transfers fees should certain clauses be met.

Net Debt Analysis

Hull Net Debt 2018

As eluded to last year and again this year, Hull are becoming a much more prudent and cautiously run club in terms of their finances and have taken this approach into managing their debt levels.

Last year Hull looked to boost cash levels, however this year they have used those extra reserves to pay off bank loans. Therefore, cash levels have significantly dropped, falling from £21.1m to £3.0m (85.8%).

Contributing to this was the £21.3m repayment in loans, net cash received from transfers of £17.1m and profit for the year of £19.3m.

Debt levels fell considerably yet again, declining from £81.3m to £63.0m (22.5%) as the club looked to become more sustainable after repaying all of their bank debt with their cash surplus rather than invest in players, potentially to aid compliance with Financial Fair Play after previous run-ins with UEFA.

To supplement this Allam has injected a further £3.0m in cash, increasing loans owed to him to £63.0m.

Net debt levels remained stable, falling from £60.2m to £60.0m as the club became continued to be conservative and the owners will be hoping this puts the club in good stead for an assault on promotion over the next year or two.

If you want to compare this to last year report, read it here.

Thanks for reading, Share with a Hull City Fan!


Please follow and like us:
error

Premier League 2018 Review – Wages

Premier League 2018 Wages Review

As Premier League clubs grow richer, so do the players as we saw in our revenue analysis, revenue has increased dramatically and so have wages, rising 18.5% to surpass the £2.5bn barrier.

In this new Premier League world, we have wages of £150k a week as commonplace throughout the league, not just the top 6. Wages rose by over £7.5m per week and this includes the growing wage of directors and key management as their competence off the field grows in importance.

This article analyses the wages of players and directors among Premier League clubs competing in the 2016/17 season.

Who’s Up, Who’s Down?

Premier League 2017 Wage Growth

Wages increased on average by 28.6% as the majority of clubs saw sharp increases due to increased player investment.

The promoted clubs were key contributors here with Burnley (59.4%), Middlesbrough (100.3%) and Hull (104.3%) experiencing the highest growth rates as they looked to align their wages with their newly earned Premier League riches. Interestingly, only Burnley survived despite being considerably more cautious with their wages than the other two.

Chelsea (-1.2%) and Liverpool (-0.6%) were surprisingly the only clubs to experience a fall in wages, albeit very small drops. Chelsea’s sales of high earners Oscar, Cuardrado (Loan), Ivanovic and Mikel were the main reasons for this in a season of few high-profile purchases. Liverpool similarly saw the exit of Benteke, Skrtel, Balotelli and Sakho who were all on high wages as Jurgen Klopp began his rebuild.

Tottenham saw wages grow by 26.9% as they looked to reward their players performances with new, improved contracts such as Kane, Alli and Eriksen. The purchases of Sissoko, Janssen and Wanyama supported this growth with the only high-earner to depart being Chadli.

Manchester City financial growth saw no signs of slowing down as wages grew by 33.5% as the Guardiola era began with a summer transfer spree featuring minimal departures as surplus players entered the final year or two of their high paid contracts, we expect wage growth to fall as these players depart at the end of their contracts.

Rivals Manchester United experienced a smaller rise of only 13.5% despite the high-profile purchases of Pogba and Ibrahimović due to a number of departures and the relative size of their wage bill already.

Leicester rewarded their Premier League winning squad with substantial pay rises leading to wage growth of 40% as the likes of Vardy, Mahrez and Schmeichel signed new deals which was added to by new higher profile players.

On the low side alongside Chelsea and Liverpool were Sunderland (0.6%) and Stoke (3.2%), possibly signalling they were worried about their soon to be relegations and were preparing for as much.

Premier League 2017 Wage Growth per week

In absolute terms, the average wage rise was £375k per week, or £19.5m a year. Leading the way however was Manchester City’s astronomical rise of £1.3m a week in wages after their transfer spree to introduce Guardiola to the Premier League.

Crystal Palace saw wages rise £600k a week after the introduction of Sam Allardyce who used the winter transfer window to significantly strengthen the squad with a sizeable investment, a tactic that ultimately worked as they secured survival.

Middlesbrough also experienced a £600k a week increase but were unfortunately much less successful in doing so after suffering relegation and the unenviable wage reduction strategy required. Wages are likely to fall automatically as relegation wage clauses come into effect.

Tottenham significant contract renewals contributed to wages rising by £517k a week as Harry Kane and Co became richer after another top 4 finish for the club.

Manchester United saw wages rise by £600k a week despite a relatively small % increase due to the enormous size of their wage bill to begin with.

As mentioned, on the other end of the scale is Chelsea and Liverpool who saw minimal wage drops per week of £50k and £15k, remaining relatively stable in terms of wages after offloading deadwood.

Arsenal also remained relatively stable with wages growing by £77k a week, a minimal 2% increase for the club.

Wage to Revenue Ratio

Premier League 2017 Wage Turnover ratio

A key performance indicator for all clubs, the wage: revenue ratio is key to a club in measuring financially stability and prudence. A high ratio suggests overspending, making profitability almost impossible whilst a ratio too low suggest over cautiousness and a failure maximise the use of resources. The average is 57% and most clubs will be aiming for a ratio of 50-55%.

The ratio shows a clear trade-off between risk and reward with clubs having to balance the need to grow and meet their targets and their financial future. Clubs near the bottom of the Premier League are likely to have higher ratios due to their lower revenues, however these clubs still spend an awful lot on wages due to the riches of staying in the Premier League.

Those higher up the table pay higher wages but see relatively higher revenue – which is what those spending large near the bottom are aspiring to.

Crystal Palace have the highest rate at 78.5% after their huge spending in the winter transfer window to preserve their Premier League status, a gamble that paid off but also potentially jeopardised their future, however such a gamble has enriched those at the club including senior management (more on this later).

Swansea’s was nearly as high at 77.3% due to low revenue and relatively high wages, a situation we hope they have remedied in 2018 after relegation which will cause this key ratio to increase.

Tottenham much discussed wage policy sees them achieve the lowest ratio at 41.4% as Daniel Levy continues to run a tight ship, something he is proud of considering their recent domestic performances, an increase in revenue will however help them increase their wages more in line with their rivals.

North London rivals Arsenal are 3rdon the list at 47.6%, another club who are notoriously known under Wenger to watch the purse strings, it must be something in the water up in North London!

Manchester United despite have one of the largest wage bills in world football have a wage to revenue ratio of only 45.3% due to the huge revenue they generate, showcasing that potentially player investment and huge wages leads to larger revenue, a model that Manchester City seem to have adopted in their earlier years.

Chelsea at 60.8% have the highest ratio due to providing players with historically high wages whilst also stockpiling young talent meaning they have more player wages on their books.

Liverpool (57%) and Manchester City (55.8%) complete the top 6 who all have lower than 61% ratios which is around the ball park most clubs should be.

Other than Chelsea, Crystal Palace and Swansea, the only other clubs with ratios above 60% are Everton (61.1%), Southampton (61.2%), Stoke (62.5%), Sunderland (66.8%) and Watford (60.3%), all clubs with aspirations of growing despite Sunderland and Stoke’s recent troubles.

Of the rest, Burnley’s low ratio (50.5%) should be commended due to their performances in 2017 and 2018. Outside of those already mentioned Bournemouth (52.4%), Hull (52.4%), Middlesbrough (53.5%) and West Ham (51.8%) all have ratios below 55%.

Rich Directors

Premier League 2017 Director Wages

Directors and key management staff are becoming increasingly vital to the success of football clubs with their business acumen key in driving revenue from off the field sources. The work of many executives has been praised in both the transfer market and in raising the profile of their club. A good executive can propel a financially ruined club into a viable business and footballing success.

This is apparent in the fact that directors’ salaries rose 19% to £41.5m despite not playing a minute of football, with the average salary being just under £4m, working out an average of £72k a week which is a respectable Premier League footballer wage.

However, note that director salary disclosures in the accounts may not show the full picture with some directors paid in other opaque companies and through other means which are hidden and difficult to locate so the numbers here are likely to be understated to some degree.

The highest director compensation paid was by Manchester United unsurprisingly considering their global profile and stock listing. Manchester United directors were paid £12.5m last year with this including stock options that may be more valuable than recorded currently.

Tottenham are the next closet some way behind with payments of £9m with Daniel Levy paying himself £6m as a golden pat on the back for the recent successes of the club that few would argue with despite his insistence of being more prudent than that on his players.

Arsenal also pay highly with directors being paid £3.4m despite performing poorly as of late.

Liverpool’s directors were paid relatively poorly compared to their above rivals, receiving a meagre £1.6m.

Chelsea and Manchester City had minimal values in their accounts. This may have to do with Chelsea having no CEO for the majority of the year and until the appointment of Guy Laurence. The payments for other key management were likely to not have been disclosed and as such no analysis can be performed. There is a similar story for Burnley as well.

The lowest outside of this appears to be Hull with payments of only £185k made to directors.

Also, below £1m were Leicester (£325k), Stoke (£806k), Swansea (£634k) and Watford (£571k). The most surprising club here is Leicester due to the absence of any significant rise in director payments despite the incredible season they recently had.

Crystal Palace have a notably high compensation package for directors with wages paid to directors of £2.4m, with Steve Parrish paying himself all of that as the club’s only director after the club steered clear of relegation last year, a controversial decision by the Mr. Parrish.

Wages Summary

Premier League 2017 Wages

There was £2.5bn in wages last year, an eye-watering £48.1m a week with Premier League clubs incurring an average wage bill of £125m. The Premier League Top 6 account for a huge 51% of total wages, showing their unparalleled financial power.

There was a change at the top of the wage bill chart as Manchester City’s continuing financial growth saw them shell out £264.1m in Guardiola’s first season, overtaking Manchester United who paid out £263.5m in wages.

Chelsea (£219.7m), Liverpool (£207.5m) and Arsenal (£199.4m) follow at around the £200m mark as they continue to pay players top dollar to maintain their power and clutch of world class players.

The ever-rising Tottenham lag their rivals yet again in this department, paying out ‘only’ £126.9m on wages due to Levy’s tight wage policy, a strategy that may see them struggle to keep competing with their rivals.

Burnley must be commended for their comfortable survival despite operating the lowest wage bill in the Premier League of £61.2m.

Bournemouth (£64.9m) and Hull (£61.3m) were the only other clubs with wages under £70m.

On the other end of the scale, Leicester (£112.6m), Everton (£104.7m), Crystal Palace (£111.8m) and Southampton (£112.4m) were the only clubs outside the top 6 with wages exceeding £100m.

With this all said, wages are likely to continue increasing as the amount of revenue continues to rise in the Premier League and player wage demands continue to rise and the price of relegation becomes costlier. Wages are likely to increase to around £3bn in the coming year.

Thanks for reading, share with a friend!


Please follow and like us:
error

Premier League Financial Review – Summary

Premier League Financial Review 2018

Here is your summary of Premier League financial performance for all Premier League clubs in 2018. As financial accounts are released one year in arrears, finances are based on 2017 season performance. In depth summaries of these finances are available by clicking the club’s name or the infographic.

Arsenal – Wenger’s Wonga

Arsenal Financial Review 2018

Bournemouth – Finances With a Cherry on Top

Bournemouth Financial Review 2018

Burnley – Marking Their Turf 

Burnley Financial Review 2018

Chelsea – Riches of Champions

Chelsea Financial Review 2018

Crystal Palace – The Price Of Survival

Crystal Palace Financial Review 2018

Everton – Stuck Toffees 

Everton Financial Review 2018

Hull – Tigers Timid Roar

Hull City Financial Review 2018

Leicester – Foxes’ Fortunes

Leicester Financial Review 2018

Liverpool – Top 4, Top Finances

Liverpool FC Financial Review 2017

Manchester City – Sky’s The Limit

Manchester City Financial Review 2018

Manchester United – No Top 4, No Problem

Manchester United Financial Review 2018

Middlesbrough – Down The River

Middlesbrough Financial Review 2018

Southampton – Saints Keep Marching On

Southampton Financial Review 2018

Stoke – Cold, Wet and Windy But Safe

Stoke Financial Review 2018

Sunderland – Out of Lives

Swansea – Survival Swans

Swansea Financial Review 2018

Tottenham – White Cash Lane

Watford – Honest Hornets

Watford Financial Review 2018

West Brom –  Unusual Addicks

West Brom Financial Review 2018

West Ham – Ambitious Hammers

West Ham Financial Review 2018

Please follow and like us:
error