Crystal Palace FC’s 2019 Finances Predicted

Crystal Palace 2019 Financial Predictions

Crystal Palace extended their longest ever stay in the Premier League, securing their 7th successive season in the top division under Roy Hodgson despite relatively low spending of £10m.

It was a season of much the same for Crystal Palace, finishing 12th (11th in 2018) in the Premier League and once again exiting the League Cup at the fourth round. There was a FA Cup run to the Quarter Final with the club just missed out on a trip to Wembley.

Financially, the fact there was little change on the pitch meant there was little change off it, with large losses once again likely due to a lack of player sales.

Let’s have a look at the numbers.

Revenue Prediction

Matchday Revenue

Crystal Palace had matchday revenue of £11m in 2018 and will see minimal change in 2018 owing to having the same number of home games (21) as in 2018.

Average Premier League attendance rose slightly from 25,063 to 25,455 (2%) which may see a slight increase in matchday revenue, however, is likely to remain around £11m.

Commercial Revenue

Crystal Palace earned £15m in commercial revenue in 2018. A new kit deal with Puma (replacing Macron) and a couple of other new partnerships should see a small rise in commercial revenue to around £17m.

Broadcasting Revenue

Premier League Payments

Broadcasting revenue was £121m for Crystal Palace in 2018, 81% of their total revenue which showcases the importance of Premier League survival to the club.

Premier League distributions remained at £114m for Crystal Palace as the slight increase in prize money available compensated for their one position drop in the league table, having been shown on TV 12 times (the same as in 2018).

Crystal Palace had an improved showing in the FA Cup, making the quarter-finals having only made the third round the previous year. This should boost broadcasting revenue by around £1m to £123m.

Other Revenue

Other revenue was £3m in 2018. As we don’t know exactly what this amount comprises of, our best estimate is it will remain at this level, having also been at £3m in 2017.

Total Revenue

Based on the above, Crystal Palace should see a slight rise in revenue from £150m to £153m. Any growth will be dependent on Crystal Palace’s commercial revenue and any lucrative new deals the club managed to make.

It would be no surprise to see revenue remain the same as in 2018, given the minimal change in performance on the pitch.

Costs Prediction

Amortisation

Crystal Palace recorded amortisation of £46m in 2018 and after a summer of only one signing for a transfer fee in Kouyate (£10m), it is likely that amortisation may fall slightly to £45m based on the lack of reinvestment this year compared to previous seasons.

Wages

Crystal Palace paid wages of £117m in 2018 and are likely to see an increase in this due to the signing of bosmans Meyer and Guaita on lucrative wages.

A few departures on free transfers will offset some of these wages and therefore we expect wages to increase slightly to £120m.

Other Operating Costs

Crystal Palace recorded other operating expenses of £24m in 2018. We expect the trend of slight increases to continue and for other costs to rise to £25m.

Total Costs

Crystal Palace’s costs were £187m in 2018, and with the above predictions we expect to increase slightly but remain at a similar level at £190m.

Any rise in costs is likely to be similar to any rise in revenue and therefore their profitability (or the lack of it) will remain relatively similar.

Transfers Analysis

It was a quiet summer for Crystal Palace with Kouyate joining for £10m. Batshuayi and Ayew joined on loan while Meyer, Guaita and Sako joined as free transfers.

There were no sales in the year with Cabaye the only notable departure after his contract expired.

This net transfer spend of £10m was considerably down on their net spend of £44m in 2018 and was the lowest net spend by the club since 2013 when they were promoted, showing a tightening of the purse strings by the club.

There were minimal player sales in 2018, however a profit on player sales of £2m was recorded. In 2019 with no player sales means there shouldn’t be any such amount recorded which will negatively impact their bottom line.

Crystal Palace had significant net transfer fee debts of £38m that were due in 2018/19, showing why they had to be more conservative last year owing to previous summer transfers. Crystal Palace also owe a further £9m in transfer fees in 2020 and beyond.

Profit/Loss Predictions

Crystal Palace recorded a loss of £33m in 2018 and when accounting for the above adjustments are likely to see a similar loss in 2019 of £35m, meaning they have total losses of nearly £70m in the last two seasons which obviously isn’t a sustainable position unless their owners are willing to input serious capital, which doesn’t seem to be the case.

This shows why the club had to sell either Aaron Wan-Bissaka or Zaha in the summer as their finances needed a boost and explains why the majority of the sale to Manchester United hasn’t been reinvested. The sale of Wan-Bissaka for £50m will be realised as all profit next year which will swing Crystal Palace back to a profit if they have a similar season to the last two.

A strong start to the season and the sale of Wan-Bissaka suggest that Crystal Palace may once again be profitable in 2020.

Thanks for reading, share with a friend!

Please follow and like us:
error

Crystal Palace FC’s 2018 Finances – No Transfers, No Profits

Crystal Palace FC's 2018 Finances

Crystal Palace started the 2018 season with a record breaking 7 losses that left their Premier League survival hanging in the balance and cost De Boer his first (and maybe last) job in England.

However, after a revival under Hodgson, Crystal Palace secured a sixth successive season in the Premier League after an astonishing 11th placed finish considering the start they had.

All of Palace’s energy went into securing their Premier League survival, coming at the expense of their cup campaigns which ended early.

A stable season but a lack of player sales saw Crystal Palace turn a £10m profit in 2017 into the £33.4m loss.

Let’s delve into the numbers.

Crystal Palace FC 2018 Profit:Loss

Revenue Analysis

Crystal Palace FC 2018 Revenue

Crystal Palace saw a slight increase in revenue, rising from £142.7m to £150.3m (5%) after a season of stability.

Matchday revenue increased from £10.6m to £10.9m (3%) despite attendance falling slightly from 25,161 to 25,063 (0.3%).

Crystal Palace are pretty much at full capacity, with an expansion of Selhurst Park a priority, however delays are putting plans to increase capacity to 34,000 in doubt. Costs are rumoured to be around £100m, although, similar to all construction projects, this is likely to be exceeded heavily.

Crystal Palace are also currently in discussions to potentially increase ticket prices, citing a low price in comparison to their London rivals as the rationale. Any increase should boost revenue (but annoy fans).

Broadcasting revenue increased from £116.9 to £121.1m (4%) after finishing 3 places higher this season despite their poor start. This increase would have been even greater had they featured more heavily on TV, after having 2 less games broadcasted this season.

Commercial revenue rose from £11.9m to £15.2m (28%). Crystal Palace benefitted from a more lucrative shirt deal with ManBetX, while they also made progress on their commercial strategy to increase commercial partnerships and LED board revenue.

Other revenue fell from £3.3m to £3.0m (9%).

Looking ahead, Crystal Palace’s revenue will remain relatively stable yet again. With Crystal Palace unlikely to improve on last year’s 11th placed finish (and may not even match it), broadcasting revenue is likely to fall slightly.

Matchday revenue is basically capped (due to capacity constraints) at around £11m unless the club progress in the cups and have more home games.

Commercial revenue is likely to increase which will hopefully offset any revenue loss caused by a lower league finish.

Costs Analysis

Crystal Palace FC Costs 2018

Crystal Palace knew their revenue was unlikely to rise much and controlled costs well. Operating expenses increased from £168.7m to £187.3m (11%). This rise did unfortunately hurt profitability, being larger than the rise in revenue (5%).

Amortisation increased significantly, rising from £32.7m to £46.0m (41%) after spending £44m in 2018 (see transfers analysis).

Interest costs increased from £1.0m to £1.1m (10%) as interest on loans grew slightly (see debt analysis).

Crystal Palace paid no tax due to their loss-making status. The large loss this year may be useful in offsetting any taxable profit in the coming years, reducing the tax bill at that time.

Crystal Palace FC Wages 2018

Wages increased slightly from £111.8m to £117.3m (5%). Despite new signings, wages remained relatively stable as the new signings were signed at modest wages while a few high earners (Mandanda, Ledley and Flamini) departed Selhurst Park.

This wage increase works out at an additional £106k a week, a tiny sum for Premier League clubs.

Director renumeration took a hit this season, dropping from £2.4m to £1.8m (25%) with Parrish’s pay falling from £2.2m to £1.6m (27%).

Looking ahead, Crystal Palace will see a slight increase in costs. Wages will rise slightly due to the signings of Meyer, Kouyate, Guatia and Sako, in particular Meyer whose wages are rumoured to be over £100k a week. The exit of the likes of Cabaye and Delaney should offset a lot of these wages.

Amortisation will increase ever so slightly due to the only signing or departure not on a free transfer being Kouyate this year.

Transfers Analysis

Crystal Palace FC Net Transfer Spend 2018

Crystal Palace saw an influx of players join the club, with 4 signings and only 1 departure (for a transfer fee).

In came Sakho (£25.4m), Sorloth (£8.1m), Riedwald (£8.1m) and Jach (£2.5m) for a combined £44.1m.

The only departure was Mandanda for £2.7m.

This saw a drop in their net transfer spend from £46.0m to £41.4m (10%), in what was a season of similar finances for the club.

Crystal Palace recorded a profit on player sales of a measly £2.4m. Last year, Crystal Palace recorded a profit on player sales of £34.7m mainly due to the sale of Bolasie. This difference of £32.3m is main reason for the £43.4m swing into the red this year.

Therefore, with a season of no player sales in 2019, Crystal Palace are likely to once again record a loss.

In cash terms, Crystal spent cash of £53.8m, recouping cash of £12.7m. This was a net cash outlay of £51.1m, a larger outlay then Palace are used to.

Crystal Palace are only owed a further £2.4m in transfer fees. However, Crystal Palace owe £49.0m in transfer fees (£40.4m due this year). This net creditor position of £46.6m shows why Crystal Palace reduced their spending this year, with such a large amount needing to be repaid soon.

On top of this, Crystal Palace are likely to face contingent transfer fees of £8.4m, while they could face an additional £4.8m, although the directors deem this to be less likely.

Debt Analysis

Crystal Palace FC Net Debt 2018

Crystal Palace kept their cash reserves robust, increasing it from £15.9m to £17.9m (13%) despite their losses.

New loans of £7.5m were used to fund these losses, pay their transfer fees and also allowed them to spend £2.1m on improving club facilities.

It is also worth noting that Crystal Palace took out a £29.3m short-term loan while they waited to receive their cash from the Premier League for the season, this has already been repaid (due to the extremely short-term nature of this loan, it has been excluded from the debt amount below).

Debt levels increased from £14.6m to £21.5m (47%) after new loans were provided by their owners. This was a nice boost for Crystal Palace that was needed to maintain a decent cash balance.

Crystal Palace hence saw a net cash balance turn into a net £3.6m debt position. This change is minor, and the club are incredibly prudently run.

An increase in spending in the last couple of years to maintain and consolidate their Premier League status was uncharacteristic of the club.

To understand their financial strategy, it is worth noting how close they were to going bust prior to Parrish’s takeover, and have since shown a greater level of financial responsibility while performing well in the Premier League.

Going forward, a new stadium is on the horizon which may further explain their prudence. Should they maintain their Premier League status after this, Crystal Palace are likely to push on and exciting times may be ahead.

Thanks for reading – Share with your football community!

Please follow and like us:
error

Premier League 2018 Review – Wages

Premier League 2018 Wages Review

As Premier League clubs grow richer, so do the players as we saw in our revenue analysis, revenue has increased dramatically and so have wages, rising 18.5% to surpass the £2.5bn barrier.

In this new Premier League world, we have wages of £150k a week as commonplace throughout the league, not just the top 6. Wages rose by over £7.5m per week and this includes the growing wage of directors and key management as their competence off the field grows in importance.

This article analyses the wages of players and directors among Premier League clubs competing in the 2016/17 season.

Who’s Up, Who’s Down?

Premier League 2017 Wage Growth

Wages increased on average by 28.6% as the majority of clubs saw sharp increases due to increased player investment.

The promoted clubs were key contributors here with Burnley (59.4%), Middlesbrough (100.3%) and Hull (104.3%) experiencing the highest growth rates as they looked to align their wages with their newly earned Premier League riches. Interestingly, only Burnley survived despite being considerably more cautious with their wages than the other two.

Chelsea (-1.2%) and Liverpool (-0.6%) were surprisingly the only clubs to experience a fall in wages, albeit very small drops. Chelsea’s sales of high earners Oscar, Cuardrado (Loan), Ivanovic and Mikel were the main reasons for this in a season of few high-profile purchases. Liverpool similarly saw the exit of Benteke, Skrtel, Balotelli and Sakho who were all on high wages as Jurgen Klopp began his rebuild.

Tottenham saw wages grow by 26.9% as they looked to reward their players performances with new, improved contracts such as Kane, Alli and Eriksen. The purchases of Sissoko, Janssen and Wanyama supported this growth with the only high-earner to depart being Chadli.

Manchester City financial growth saw no signs of slowing down as wages grew by 33.5% as the Guardiola era began with a summer transfer spree featuring minimal departures as surplus players entered the final year or two of their high paid contracts, we expect wage growth to fall as these players depart at the end of their contracts.

Rivals Manchester United experienced a smaller rise of only 13.5% despite the high-profile purchases of Pogba and Ibrahimović due to a number of departures and the relative size of their wage bill already.

Leicester rewarded their Premier League winning squad with substantial pay rises leading to wage growth of 40% as the likes of Vardy, Mahrez and Schmeichel signed new deals which was added to by new higher profile players.

On the low side alongside Chelsea and Liverpool were Sunderland (0.6%) and Stoke (3.2%), possibly signalling they were worried about their soon to be relegations and were preparing for as much.

Premier League 2017 Wage Growth per week

In absolute terms, the average wage rise was £375k per week, or £19.5m a year. Leading the way however was Manchester City’s astronomical rise of £1.3m a week in wages after their transfer spree to introduce Guardiola to the Premier League.

Crystal Palace saw wages rise £600k a week after the introduction of Sam Allardyce who used the winter transfer window to significantly strengthen the squad with a sizeable investment, a tactic that ultimately worked as they secured survival.

Middlesbrough also experienced a £600k a week increase but were unfortunately much less successful in doing so after suffering relegation and the unenviable wage reduction strategy required. Wages are likely to fall automatically as relegation wage clauses come into effect.

Tottenham significant contract renewals contributed to wages rising by £517k a week as Harry Kane and Co became richer after another top 4 finish for the club.

Manchester United saw wages rise by £600k a week despite a relatively small % increase due to the enormous size of their wage bill to begin with.

As mentioned, on the other end of the scale is Chelsea and Liverpool who saw minimal wage drops per week of £50k and £15k, remaining relatively stable in terms of wages after offloading deadwood.

Arsenal also remained relatively stable with wages growing by £77k a week, a minimal 2% increase for the club.

Wage to Revenue Ratio

Premier League 2017 Wage Turnover ratio

A key performance indicator for all clubs, the wage: revenue ratio is key to a club in measuring financially stability and prudence. A high ratio suggests overspending, making profitability almost impossible whilst a ratio too low suggest over cautiousness and a failure maximise the use of resources. The average is 57% and most clubs will be aiming for a ratio of 50-55%.

The ratio shows a clear trade-off between risk and reward with clubs having to balance the need to grow and meet their targets and their financial future. Clubs near the bottom of the Premier League are likely to have higher ratios due to their lower revenues, however these clubs still spend an awful lot on wages due to the riches of staying in the Premier League.

Those higher up the table pay higher wages but see relatively higher revenue – which is what those spending large near the bottom are aspiring to.

Crystal Palace have the highest rate at 78.5% after their huge spending in the winter transfer window to preserve their Premier League status, a gamble that paid off but also potentially jeopardised their future, however such a gamble has enriched those at the club including senior management (more on this later).

Swansea’s was nearly as high at 77.3% due to low revenue and relatively high wages, a situation we hope they have remedied in 2018 after relegation which will cause this key ratio to increase.

Tottenham much discussed wage policy sees them achieve the lowest ratio at 41.4% as Daniel Levy continues to run a tight ship, something he is proud of considering their recent domestic performances, an increase in revenue will however help them increase their wages more in line with their rivals.

North London rivals Arsenal are 3rdon the list at 47.6%, another club who are notoriously known under Wenger to watch the purse strings, it must be something in the water up in North London!

Manchester United despite have one of the largest wage bills in world football have a wage to revenue ratio of only 45.3% due to the huge revenue they generate, showcasing that potentially player investment and huge wages leads to larger revenue, a model that Manchester City seem to have adopted in their earlier years.

Chelsea at 60.8% have the highest ratio due to providing players with historically high wages whilst also stockpiling young talent meaning they have more player wages on their books.

Liverpool (57%) and Manchester City (55.8%) complete the top 6 who all have lower than 61% ratios which is around the ball park most clubs should be.

Other than Chelsea, Crystal Palace and Swansea, the only other clubs with ratios above 60% are Everton (61.1%), Southampton (61.2%), Stoke (62.5%), Sunderland (66.8%) and Watford (60.3%), all clubs with aspirations of growing despite Sunderland and Stoke’s recent troubles.

Of the rest, Burnley’s low ratio (50.5%) should be commended due to their performances in 2017 and 2018. Outside of those already mentioned Bournemouth (52.4%), Hull (52.4%), Middlesbrough (53.5%) and West Ham (51.8%) all have ratios below 55%.

Rich Directors

Premier League 2017 Director Wages

Directors and key management staff are becoming increasingly vital to the success of football clubs with their business acumen key in driving revenue from off the field sources. The work of many executives has been praised in both the transfer market and in raising the profile of their club. A good executive can propel a financially ruined club into a viable business and footballing success.

This is apparent in the fact that directors’ salaries rose 19% to £41.5m despite not playing a minute of football, with the average salary being just under £4m, working out an average of £72k a week which is a respectable Premier League footballer wage.

However, note that director salary disclosures in the accounts may not show the full picture with some directors paid in other opaque companies and through other means which are hidden and difficult to locate so the numbers here are likely to be understated to some degree.

The highest director compensation paid was by Manchester United unsurprisingly considering their global profile and stock listing. Manchester United directors were paid £12.5m last year with this including stock options that may be more valuable than recorded currently.

Tottenham are the next closet some way behind with payments of £9m with Daniel Levy paying himself £6m as a golden pat on the back for the recent successes of the club that few would argue with despite his insistence of being more prudent than that on his players.

Arsenal also pay highly with directors being paid £3.4m despite performing poorly as of late.

Liverpool’s directors were paid relatively poorly compared to their above rivals, receiving a meagre £1.6m.

Chelsea and Manchester City had minimal values in their accounts. This may have to do with Chelsea having no CEO for the majority of the year and until the appointment of Guy Laurence. The payments for other key management were likely to not have been disclosed and as such no analysis can be performed. There is a similar story for Burnley as well.

The lowest outside of this appears to be Hull with payments of only £185k made to directors.

Also, below £1m were Leicester (£325k), Stoke (£806k), Swansea (£634k) and Watford (£571k). The most surprising club here is Leicester due to the absence of any significant rise in director payments despite the incredible season they recently had.

Crystal Palace have a notably high compensation package for directors with wages paid to directors of £2.4m, with Steve Parrish paying himself all of that as the club’s only director after the club steered clear of relegation last year, a controversial decision by the Mr. Parrish.

Wages Summary

Premier League 2017 Wages

There was £2.5bn in wages last year, an eye-watering £48.1m a week with Premier League clubs incurring an average wage bill of £125m. The Premier League Top 6 account for a huge 51% of total wages, showing their unparalleled financial power.

There was a change at the top of the wage bill chart as Manchester City’s continuing financial growth saw them shell out £264.1m in Guardiola’s first season, overtaking Manchester United who paid out £263.5m in wages.

Chelsea (£219.7m), Liverpool (£207.5m) and Arsenal (£199.4m) follow at around the £200m mark as they continue to pay players top dollar to maintain their power and clutch of world class players.

The ever-rising Tottenham lag their rivals yet again in this department, paying out ‘only’ £126.9m on wages due to Levy’s tight wage policy, a strategy that may see them struggle to keep competing with their rivals.

Burnley must be commended for their comfortable survival despite operating the lowest wage bill in the Premier League of £61.2m.

Bournemouth (£64.9m) and Hull (£61.3m) were the only other clubs with wages under £70m.

On the other end of the scale, Leicester (£112.6m), Everton (£104.7m), Crystal Palace (£111.8m) and Southampton (£112.4m) were the only clubs outside the top 6 with wages exceeding £100m.

With this all said, wages are likely to continue increasing as the amount of revenue continues to rise in the Premier League and player wage demands continue to rise and the price of relegation becomes costlier. Wages are likely to increase to around £3bn in the coming year.

Thanks for reading, share with a friend!


Please follow and like us:
error

The True Costs of Transfers

Premier League True Summer Transfer Cost

The True Costs of the Premier League 2018 Summer Transfer Window

The Premier League transfer window has officially shut with over £1.2bn spent by Premier League clubs ahead of the new season.

Clubs have to be wary of Financial Fair Play when purchasing players to avoid penalties and bans (for more on this click here) and also need to ensure they are running sustainably for their owners etc.

This brings us to this article, which will explain the true costs of transfers from the 2018 summer transfer window explained briefly below:

When clubs sign a player, from an accounting perspective this is not all charged in the year of the transfer as the payments are matched to how the player will be used. So, a player signing for £50m on a 5-year contract is deemed to cost the club £10m a year, known as the amortisation cost. This is the true costs of the transfer per season for the club.

Another key element is player sales. In this regard the profit the club gain is not simply the transfer fee received minus the transfer fee paid, it is the transfer fee received less the remaining value of the player sold. So, for a £50m player on a 5-year contract, he will be ‘worth’ £50m minus the amortisation charges to date, so after two years of charges, the player will be ‘worth’ £30m. Hence, should a player be sold 2 years later for £50m, a ‘profit’ of £20m will be recorded, rather than nothing like many people believe.

This article will analyse each Premier League club’s business and compare to their counterparts.

Due to the availability of data, this excludes the costs of loans and player wages. All transfer fees and contract lengths are via Transfmartk.co.uk. In order to simplify the amortisation costs, we have ignored contract renewals which make the calculation more complex without much added insight.

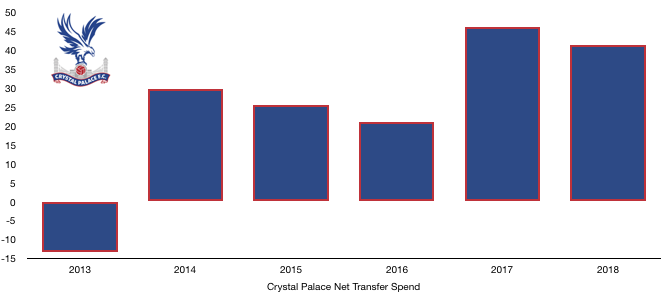
Let’s Not Talk About Spend, Let’s Talk About Net Spend

Premier League Transfer Net Spend

Premier League clubs had an active transfer window despite its shortening, spending over £1.2bn, receiving only £353m in return, leaving the club with an astronomical net spend of £909m.

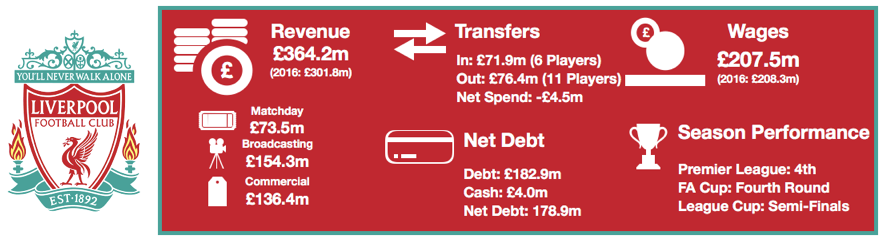
This was due to higher spending by certain clubs, with Liverpool leading the way by a distant after investing heavily following their Champions League heartache with Naby Keita, Fabinho, Alisson and Shaqiri joining while only Danny Ward left, leaving the merseysiders with a net spend of £151m.

Fulham became the first promoted club to ever break the £100m barrier after a barnstorming transfer window with 7 players arriving for transfer fees and only 1 leaving. This led to the club having a net transfer spend of £101m with Seri the pick of the players signed.

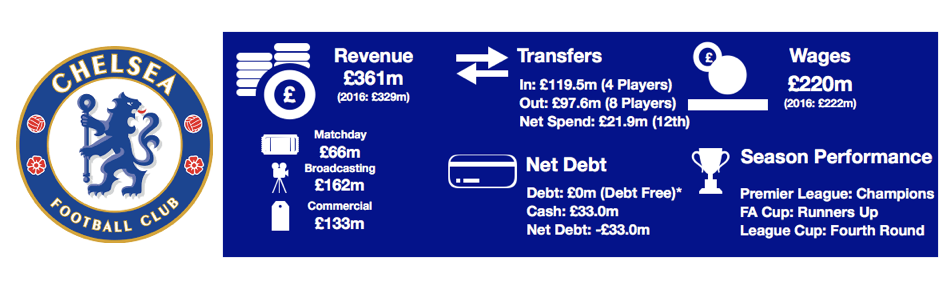
Fellow West Londoners Chelsea had the third biggest net spend at £92m after breaking the world transfer record for a goalkeeper in the £72m paid for Kepa after losing Courtois to Real Madrid and they also signed Jorginho.

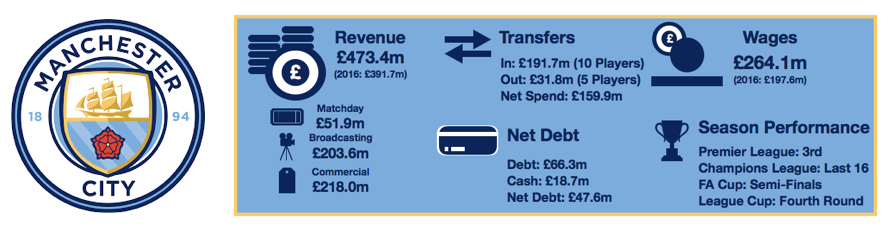
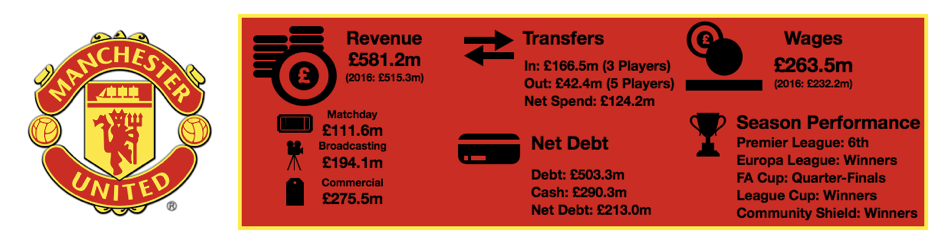
Manchester United and Manchester City had quiet windows with both making one big purchase a piece with Fred joining United (along with Dalot and Grant) and Mahrez joining City.

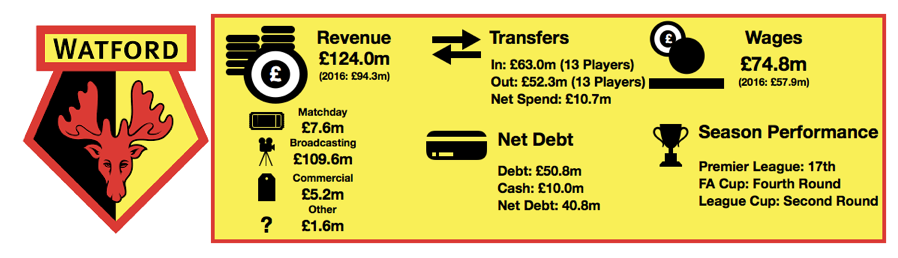
At the other end of the scale were Watford with a net transfer spend of minus £23m after not reinvesting all of their Richarlison windfall. Newcastle also were in the black after recording a net transfer spend of minus £13m as Mike Ashley used transfer cash received to purchase House of Fraser rather than reinvest in the Toon.

Additional Amortisation Costs

Premier League Amortisation Costs

Premier League clubs face additional transfer costs of £275m this year alone after a huge transfer spend of over £1.2bn, with this cost spread of the players signed contracts which average at just over 4-year contracts.

Amortisation costs are, as explained above, based on transfer spend and contract lengths and as such the costs are higher for larger spends and also higher when contract lengths are shorter. A key example is Kepa, a £72m keeper who signed a 7-year contract, costing Chelsea just over £10m a year. While Mahrez, a £61m purchase on a 5-year contract cost Manchester City more at just over £12m a year despite the smaller transfer fee.

Liverpool unsurprisingly lead the way after their impressive transfer window where they spent £164m with Alisson signing a 6-year contract while Keita, Fabinho and Shaqiri signed 5-year deals. Liverpool will have additional costs of £31m after these deals.

Fulham had the second highest net spend after their £105m 7 player splurge with contracts lengths 4 years on average, bringing amortisation costs of £24m over that period.

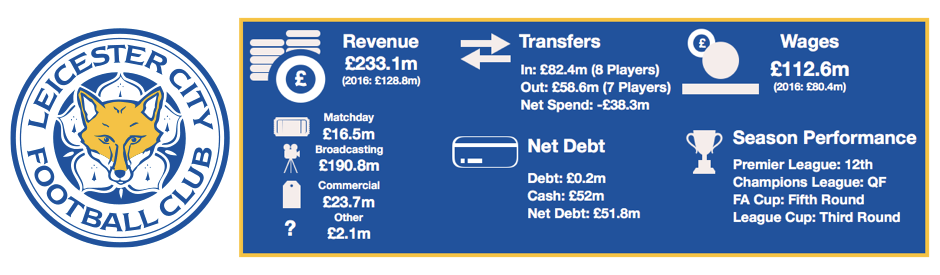
Leicester despite their relatively small net spend have a large transfer costs due to their £103m spend with the Mahrez deal diluting their net spend after the club reinvested the Mahrez cash and then some, leading to an amortisation cost of £22m.

Chelsea and West Ham also had large amortisation costs above £20m after their productive transfer windows.

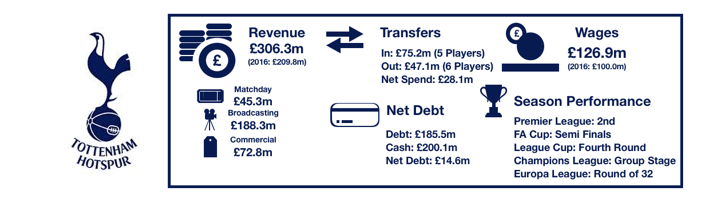
Tottenham were at the other end of scale after an inactive transfer window, becoming the first club since the transfer window came into effect in 2003 not to purchase or sell a player.

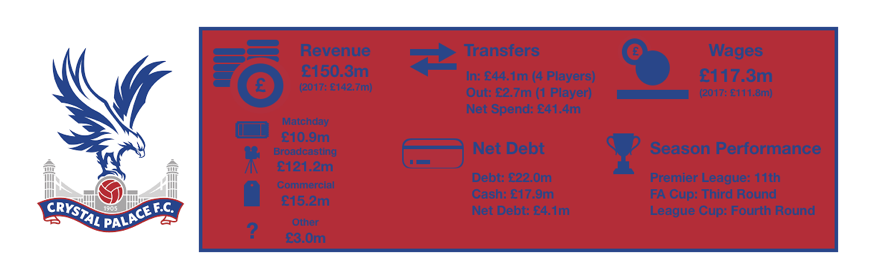
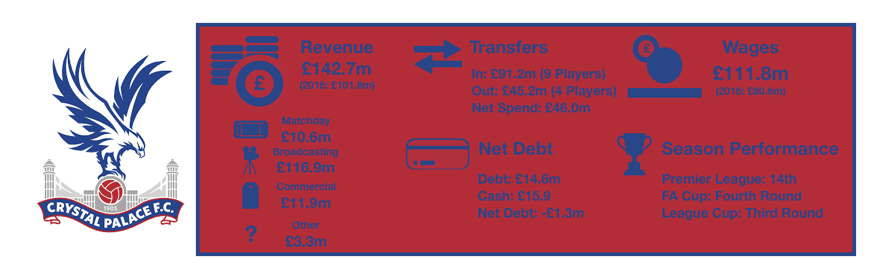
Crystal Palace were the only other club to have an additional amortisation cost below £5m.

Amortisation Costs Savings

Premier League Amortisation Savings

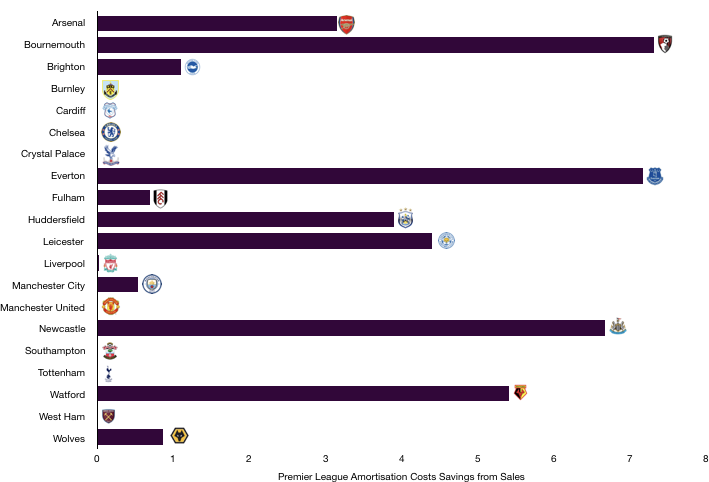
Premier League clubs saved £41m on amortisation cost after after player sales of £353m with many players sold either brought cheaply or have been long serving players that no longer attract amortisation costs after staying longer than their original contract.

Amortisation costs savings are driven again by the transfer fee paid when the player was brought and their original contract length. So, for instance Daley Blind signed for Manchester United 4 years ago for £15.8m on a 4-year contract, costing Manchester United just under £4m a year for those 4 years. Now that the 4 years are up, Blind costs United nothing from an accounting perspective, so no amortisation costs are saved and hence no savings included in our calculations.

As such many Premier League clubs didn’t recorded any savings as the players sold had already seen their entire transfer fee amortised. This includes players signed as youths such as Danny Ward at Liverpool or long serving players such as Courtois at Chelsea.

In a couple of situations, players were signed and immediately sold. This was the case for Benik Afobe at Wolves and Mikel Merino for Newcastle. In both these cases the amortisation costs were excluded when calculating additional costs and savings.

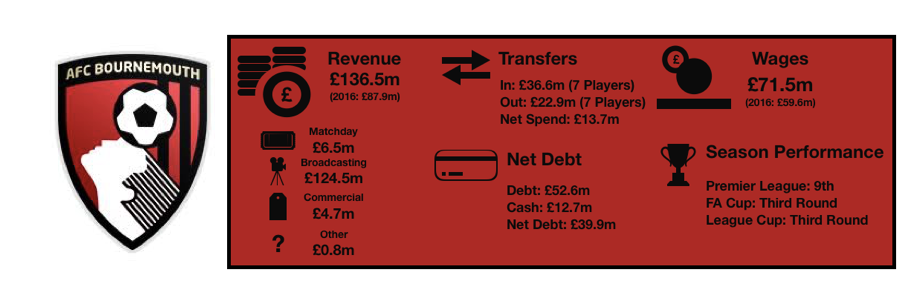
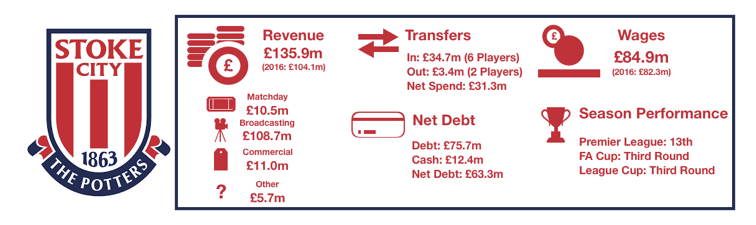
Bournemouth were the biggest savers, saving just under £8m after the sales of the after mentioned Benik Afobe to Wolves (before Wolves later sold him to Stoke), Lewis Grabban and Max Gradel.

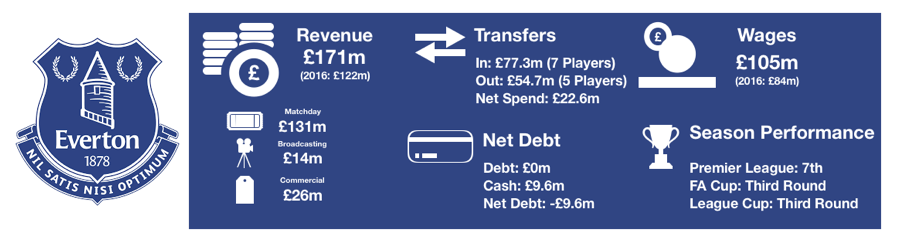
Everton (£7m), Newcastle (£6m) and Watford (£5.5m) were the only other clubs to save in excess of £5m on player sales after the sales of the likes of Klassen, Mitrovic and Richarlison.

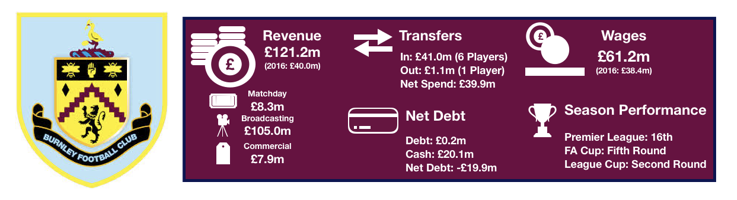
Burnley, Cardiff, Crystal Palace and Tottenham sold no players hence the reason for their lack of amortisation costs savings.

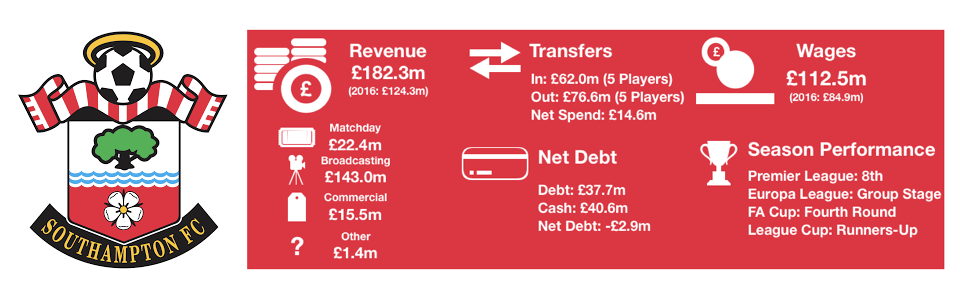
Chelsea, Liverpool, Manchester United, Southampton and West Ham also had no amortisation costs savings despite player sales due to the players sold having been at the club for at least their original contract lengths such as Courtois, Danny Ward, Blind, Tadic and Kouyate.

Profit, Profit, Profit (Or Loss)

Premier League Transfer Profit

Premier League clubs due to this made profits on their sales of £247m after selling players for £353m, a 70% return on investment.

When players are sold, as seen above, this may not lead to amortisation costs savings if the players amortisation costs were low due to the price paid or they have been at the club a long time.

This doesn’t mean they receive nothing, as the amount earned is recorded as a profit on player sales. This is recorded as the transfer fee received minus their remaining value as explained in the introduction. However, to avoid you having to scroll up, here is an example from this season using Courtois.

Courtois cost Chelsea £8m 7 years ago on a 5-year contract, costing the club £1.6m a year initially. Each year he is worth less of his transfer fee, so after 1 year he is worth £6.4m and after 2 years £4.8m etc. After 5 years he is worth essentially zero, at this point when he is sold the transfer fee received is all profit, so Chelsea record a profit of £31.5m.

Clearly the biggest benefiters here were Leicester after their sale of Mahrez was essentially all profit and hence the club recorded a profit of £67.1m.

Chelsea also benefited as described above, whilst Watford were the only other club to record a profit of more than £30m after their sale of Richarlison.

Everton were one of only two clubs to make a loss after the costly purchases of Klassen and Funes Mori who they both made a loss on after buying them recently and then selling on the cheap. Leading to a loss of £3.8m.

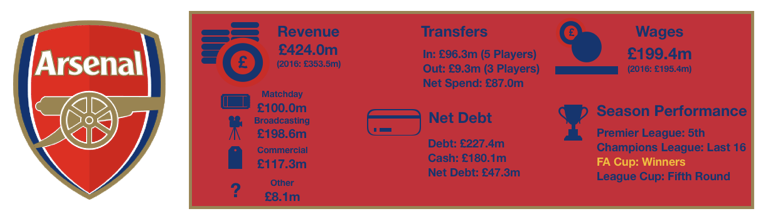
Arsenal also made a loss on the flop transfer of Lucas Perez, diluted slightly by the sale of academy graduate Akpom.

Burnley, Cardiff, Crystal Palace and Tottenham made no transfer sales and hence recorded no profit or loss this year.

The Summary – The True Cost

Premier League True Transfer Cost

To work out the true cost of this transfer window we use the following formula:

Additional amortisation costs – Amortisation costs saved -/+ Profit/Loss on player sales.

This gives an interesting picture for Premier League clubs with a net transfer costs of minus £13.9m! Meaning Premier League clubs as a whole have saved on transfers this year from a Financial Fair Play perspective.

This is heavily skewed due to the net savings made by Leicester, Watford and Newcastle in particular.

Leicester, due to the Mahrez deal have made a saving of approximately £50m after their new signings, while Watford and Newcastle have also saved in excess of £20m.

Both Manchester clubs are in the black after making one big purchase each and selling a couple fringe players.

Chelsea are also in the black after selling Courtois.

Fulham have the highest cost of £20m after their sensation transfer window in which they spent hugely for a Premier League newcomer, making a statement on their ambitions.

Liverpool were unsurprisingly up there with a net cost of £18m. Everton and Arsenal were the only other clubs with a net cost exceeding £15m.

To put this all into perspective there is a mismatch. The profits received are all given in the period of sale, while new transfers are spread over their contract. This means that Chelsea, despite making a profit on Courtois, and hence their net costs are negative, will indeed see amortisation costs rise in the long run as next year they will not have that Courtois profit.

The same is the case for amortisation costs saved, for some of the players sold, they may only have had one more year of amortisation costs and as such this saving will not be there next year and hence they will see amortisation costs rise the following year.

Amortisation costs have risen over the years and will continue to as long as clubs net spends are still as large as they are.

I hope you found this article insightful, share with a friend!

Please follow and like us:
error

Premier League Financial Review – Summary

Premier League Financial Review 2018

Here is your summary of Premier League financial performance for all Premier League clubs in 2018. As financial accounts are released one year in arrears, finances are based on 2017 season performance. In depth summaries of these finances are available by clicking the club’s name or the infographic.

Arsenal – Wenger’s Wonga

Arsenal Financial Review 2018

Bournemouth – Finances With a Cherry on Top

Bournemouth Financial Review 2018

Burnley – Marking Their Turf 

Burnley Financial Review 2018

Chelsea – Riches of Champions

Chelsea Financial Review 2018

Crystal Palace – The Price Of Survival

Crystal Palace Financial Review 2018

Everton – Stuck Toffees 

Everton Financial Review 2018

Hull – Tigers Timid Roar

Hull City Financial Review 2018

Leicester – Foxes’ Fortunes

Leicester Financial Review 2018

Liverpool – Top 4, Top Finances

Liverpool FC Financial Review 2017

Manchester City – Sky’s The Limit

Manchester City Financial Review 2018

Manchester United – No Top 4, No Problem

Manchester United Financial Review 2018

Middlesbrough – Down The River

Middlesbrough Financial Review 2018

Southampton – Saints Keep Marching On

Southampton Financial Review 2018

Stoke – Cold, Wet and Windy But Safe

Stoke Financial Review 2018

Sunderland – Out of Lives

Swansea – Survival Swans

Swansea Financial Review 2018

Tottenham – White Cash Lane

Watford – Honest Hornets

Watford Financial Review 2018

West Brom –  Unusual Addicks

West Brom Financial Review 2018

West Ham – Ambitious Hammers

West Ham Financial Review 2018

Please follow and like us:
error

Crystal Palace 2018 Financial Review

Crystal Palace Financial Review 2018

Crystal Palace finally released their financial results after HMRC threatened to strike off the club following the late filing of these results.

Crystal Palace once again secured Premier League survival and a fifth consecutive season in the top flight after looking doomed at various stages of the season under Alan Pardew and even at times under Sam Allardyce before the latter steered them clear of the jaws of relegation, achieving a 14thplaced finish, 1 place higher than last year.

Crystal Palace enjoyed their 2016 FA Cup run, going within touching distance of winning the trophy, no such excitement was forthcoming this season as they suffered early exits from both cup competitions, but the main aim of Premier League survival was achieved.

In achieving survival, Crystal Palace returned to profitability after a loss of £5.6m last year, achieving a profit of £10.0m.

Let’s delve into the numbers.

Crystal Palace Profit:Loss

Revenue Analysis

Crystal Palace Revenue

Crystal Palace saw their revenue soar to record levels after a slight dip last year, increasing from £101.8m to £142.7m (40.2%)

Despite this rise, matchday revenue dropped, falling from £11.9m to £10.6m (10.9%) mostly due to having less home games due to their significantly poorer domestic cup campaigns compared to the previous year. Premier League matchday income remained relatively stable.

Broadcasting revenue rose significantly, increasing from £78.0m to £116.9m (49.9%) as the new Premier League TV deal kicked in, while their battle with relegation yielded entertainment at the end of the season and they were rewarded with four more televised games than the previous season, helping achieve this big boost in revenue. This would have been even higher if they had matched last season’s domestic cup performance.

Commercial revenue also rose, offsetting the fall in matchday revenue by increasing from £10.2m to £11.9m (16.7%). This represents a good year commercially for the club as the look to exploit their consolidated Premier League status.

Crystal Palace will likely see revenue rise to new records again after a higher league finish however this may be dampened by less televised games, while another poor domestic campaign won’t add any revenue of note. With matchday revenue to remain relatively stable, a good commercial season may be necessary to continue their forward momentum.

Expense Analysis

Crystal Palace Operating expenses

Crystal Palace’s expenses rose at a higher rate than revenue, increasing from £118.3m to £168.7m (42.6%).

Amortisation costs rose significant from £20.4m to £32.7m (60.3%) after huge player investment, with the majority coming in the January Transfer Window as they bid to avoid relegation, knowing the investment was worth the risk to attempt to maintain their Premier League status.

Crystal Palace saw net interest expense boom after an increase in debt from their owners saw their net interest increase from £0.2m to £1.1m. This interest has since been waivered by the owners.

Crystal Palace Wages

Crystal Palace unsurprisingly saw a sharp rise in wages, increasing from £80.6m to £111.8m (38.7%) after the significant transfer activity in the winter saw expensive players join Crystal Palace’s battle against relegation.

These extra wage costs work out at an eye-watering extra £600k a week – showing the cost of survival.

Crystal Palace paid their only director, believed to be Steve Parrish, was paid a handsome £2,446,000, tripling from his pay of £787,000 last year after achieving their objectives for another season with his gambles paying off – First sacking Alan Pardew, then hiring Big Sam, before giving him a sizeable transfer kitty that lifted them clear of relegation.

Crystal Palace paid tax of £1.8m last year, an effective tax rate of 15.3% after utilising some of last year’s losses.

Transfers Analysis

Crystal Palace Net Transfer Spend

As already mentioned, Crystal Palace invested significantly in players in the summer transfer window and especially in the winter transfer window as they realised the danger of relegation was real, bringing in 4 players in January and 9 players in total, while only 4 departed Selhurst Park.

In came Christian Benteke (£28.1m), Townsend (£14.0m), Milivojevic (£13.6m), Schlupp (£12.4m), Tomkins (£10.5m), Van Aanholt (£9.5m) and Jonathan Benteke (£0.1m) while Sakho (£2.1m) and Remy (£0.9m) join on loan, coming in at a combined £91.2m.

Out went Bolasie (£26.0m), Gayle (£10.8m), McCarthy (£4.2m) and Jedinak (£4.1m) for a combined £45.2m.

This led to a significant net transfer spend of £46.0m, a huge increase from last year’s £4.9m net transfer spend. This investment in transfers was hugely successful as the £37.6m spent in January ensured Premier League survival that will be worth at least double that investment in the short term, proving success favours the brave and Crystal Palace were certainly that.

Crystal Palace also achieved an accounting profit on player sales of £34.7m due to the sizeable sales of Bolasie and Gayle.

Crystal Palace had a large cash outlay after their transfer activity with a net cash outlay of £29.4m as they spent £63.4m and received £34.0m. This is compared to a net cash outlay of £22.1m last year, a 33% increase.

Worryingly for future transfer windows, Crystal Palace owe a significant £45.9m on transfer fees from their recent activities while they are only owed £11.4m and as such, may face restraints on transfer activity over the next couple of years.

Crystal Palace also have a potential £2.6m extra payable in respect of contingent transfer fees.

Assets/Liabilities Analysis

Crystal Palace Net Debt

Crystal Palace had the cash reserves to fund their transfer activity in January and decided to use it with cash levels nearly doubled from £8.1m to £15.9m (96.3%) as the profit made in the year helped supplement the increased spending levels while their owners pumped in another £7.5m to ensure that cash levels were high enough.

Debt levels hence rose after the new loans from their owners, more than doubling from £6.4m to £14.6m (128.1%). The majority of the debt is from their owners with a £7.5m infusion this season.

Despite this, Crystal Palace continued to continue in a net cash position falling slightly from £1.7m to £1.3m (23.5%). This will come in handy due with their upcoming Selhurst Park redevelopment that will require significant funding, whether from bank debt or owner debt or a combination.

Thanks for reading – share with a Crystal Palace fan!


Please follow and like us:
error

You’ve Been Sponsored

You've been sponsored

Sponsorship revenue is a major source of income for premier league clubs and has been increasing year on year. Commercially vital to clubs, major sponsorships provide revenue of a long period due to the contracts usually being over a few years. This year club sponsorships brought in £282 million in revenue for premier league clubs before taking into the various partnerships they also delve into. This article will will go into detail about the types of industries that are attracted to invest and sponsor football clubs. We will also look at kit manufacturers and the role they play in football finance.

Football sponsorship has changed immensely over the years. Looking at the last 11 years (2007 – 2017), Beer has diminished as a large purchaser of sponsorships with no current club having a beer manufacturer as a sponsor. Betting companies have dominated as of late with a high of 9 companies donning sponsorship deals in 2016/17 season, nearly half of all clubs. This makes perfect sense being that football fans represent a key audience for betting companies. Interestingly, this space is not dominated by the largest, most well-known betting companies (other than Bet365 and BetWay), rather overseas and casino gambling companies being the most keen sponsors. It would be interesting to see if the likes of Paddy Power and Ladbrokes decide to enter this space in the future.

Premier League Sponsorship Companies

Financial services companies are aiming to fill the gap left since Barclays no longer sponsor the Premier League. Banks, Insurance and pay-day loans companies are all present here and the financial sector has been ever present in the sponsoring premier league clubs, with at least 3 on average in each of age last 11 years.

Airlines are another major part of the football clubs with two of the largest clubs, Arsenal and Manchester City representing the industry. Both have long standing partnerships with their respective airline.

Other industries to have sponsored Premier League clubs over the years include Sports fashion, Charities, Automobiles and confusingly a Zoo!

Premier League Shirt Sponsorship

As mentioned, sponsorships are a huge source of cash for the clubs with over £282m coming from shirt sponsors alone. Above we have the league table of shirt sponsors. It has a very familiar look to it, with domination from the top 6 who take home over 75% of sponsorship revenue. Man United show their dominance as the most reputable club in English football if not the world, with their Chevrolet deal bring them a handsome £47m a year. While newly promoted Huddersfield and Brighton at the foot of the table with deals of £1.5m each, more than 30 times less than Manchester United.

West Ham can be pleased at being 7th with their BetWay sponsorship bring in £10m a year, this is due to run until the end of this season and they will be hoping a strong showing in the league this season can lead to a similar, if not larger deal especially with the attraction of such of large stadium and tourist attraction for prospective sponsors.

Leicester have a long term agreement with shirt and stadium sponsor King Power and have yet to really cash in their title heroics through this commercial medium.

Interestingly, all London clubs are in the top half of the table, suggesting their is a preference among sponsors to pay a premium to sponsor London clubs, with Crystal Palace above the likes of Newcastle, Leicester, West Brom and Southampton.

Please Stay!

In terms of turnover of club sponsorships, only Tottenham of the Premier League ever-presents has had more than 2 sponsorships, with 6 in the 11 years analysed. Only Arsenal however have not changed sponsors during this  period, however most of these changes were after a long period with that sponsor and we suspect their current deals to continue for the foreseeable future. West Brom have a record high of 7 sponsors in 9 years (including 1 year with none), this is interesting as to whether this indicates poor commercial success or just a policy of renewal. This doesn’t seem to be working with their current deal the 4th worst in the league ahead of only newly-promoted Brighton and Huddersfield, and Burnley.

Kitted Out

Premier League Kit Deals

Kit manufacturer income is another major source of sponsorship income, many large sport brands pay millions to create kits for clubs, profiting from the sales of these. The largest two manufactures are the most well known sports brand in the world, Adidas and Nike. Adidas have seen a huge decline however since their high of 9 kits in 2013 to only 3 in 2017, even losing Chelsea who cut their sponsorship short to sign for Nike last season, paying £67m in the process. The spread of sport companies has diversified in recent years with none dominating as was the case with Adidas, Nike and Umbro in previous years. Umbro were previously a huge producer of kits, making 6 kits in 2007, the largest at that time to none in 2013 before renewing their presence recently with 3 currently rocking the diamond on their kits.

It will be interesting to see how Adidas react to their recent fall, they may decide to attract a large club such as Arsenal to their ranks after missing out on Manchester City who have agreed a deal with Puma for next season.

Speaking of Puma, they lead the way this year for clubs wearing their brand, which has been on a steady increasing trend since 2007.

Premier League Kit Deal Income

There is the usual pattern for Kit makers as there is in performance in domestic leagues, the top 6 dominate due to their domestic success and the large fan bases that come with that. The top 6 take home a remarkable 89% of income generated from kit manufacturers.

Surprisingly, Manchester City lag their domestic rivals significantly in the value of their deal with Nike, coming in at only £12m a year compared to the £75m Adidas deal of their Manchester rival or £60m a year deal of Chelsea who also have their kits made by Nike, something that will be rectified once Puma take over in the summer in a £50m a year deal.

Data was unavailable for Huddersfield and Brighton, however we suspect their deals to be around the £1m mark, maybe lower than Bournemouth who are bottom with an £800k annual deal.

Sleeves of Gold

A new phenomenon among premier league clubs is the introduction of sleeve sponsorships, with 17 out of the 20 premier league teams (Arsenal, Manchester United and Tottenham are yet to have one). This has brought in on average £3m a year extra revenue to premier league clubs, for example Liverpool Western Union deal has brought in £5m a year to the clubs coffers. Chelsea have the largest sleeve sponsor deal to date, with an extra £8m year brought in, while at the other end of the scale Huddersfield only bring in £300k in extra revenue from their sleeves.

Premier League Sleeve Sponsors

I hope you enjoyed this article, please share and like us on Facebook and Twitter.

Please follow and like us:
error

Matchday Money – Gameweek 20

Matchday Money Gameweek 20

Welcome to the first in a new series where we estimate the matchday gate receipts taken at all premier league games each week. We will compare the revenue generated between teams and compare their strategy for maximising matchday revenue.

The revenue is calculated based on an average of the highest and lowest prices offered to club members for each match. This amount is then multiplied by the number of tickets available for sale which for home teams is attendance less away ticket allocation and season tickets sold. Away teams is simply the away ticket allocation multiplied by the away ticket price. A separate article will analyse the season ticket revenue taken by each club.

The away allocation differs from game to game with it up to negotiation between the clubs. The lower of 10% of stadium capacity or 3,000 seats must be offered to away teams on each matchday, however this is not always taken up as clubs analyse the demand for the game among their fans and choose accordingly.

Here are the matchday results for gameweek 20:

Bournemouth 3 – 3 West Ham

Chelsea 2 – 0 Brighton

Crystal Palace 2 – 3 Arsenal

Huddersfield 1 – 1 Stoke

Liverpool 5 – 0 Swansea

Manchester United 2 – 2 Burnley

Newcastle 0 – 1 Manchester City

Tottenham 5 – 2 Southampton

Watford 2 – 1 Leicester

West Brom 0 – 0 Everton

Gameweek 20 Analysis

Premier League Matchday 19 Stadium Attendance

Chelsea led the way in stadium capacity percentage with 99.8% of the stadium filled as 41,568 fans flocked to their boxing day fixture, closely followed by Newcastle fans who watched their team play league leaders Manchester City. Unsurprisingly, Manchester United’s attendance of 75,046 was the highest by a distance with Tottenham second nearly 20,000 behind despite a stadium capacity percentage of 61.6% in their temporary 90,000 seater home.

Premier League Gameweek 19 Matchday Revenue

Despite their lowly stadium capacity %, Tottenham led the way with gate receipts with takings of over £1.3m, in part due to their high ticket prices of £55 and the fact they only sold 28,000 season tickets for Wembley, meaning a more matchday tickets on sale equating to a higher taking each matchday.

Premier League Matchday 19 Home Revenue

Liverpool’s season ticket sales of 25,000 also allow them to benefit from more expensive matchday tickets. Manchester United and Chelsea complete the top 4 this week with Manchester United’s lower due to the 55,000 season tickets sold. These amounts are more secure, so there is always a trade off between the guaranteed selling of season tickets and the potential for empty seats on matchday.

Bournemouth’s 11,360 seat stadium, combined with season ticket sales of 7,000 mean their takings from games are low, something they will be hoping to rectify after stabilising in the Premier League.

Premier League Matchday 19 Away Revenue

For away teams the revenue is usually fairly balanced, with the away allocation always fairly similar. All premier league teams agreed to cap away ticket prices to £30, with Arsenal even taking it a step further at £26. Southampton playing away to spurs were allocated the full 3,000 meaning they lead the way in away matchday revenue, followed closely by Brighton, Burnley Manchester City and Swansea – who all played teams with stadium capita of over 45,000. West Ham lag the rest by far, playing at the smallest stadium in the top flight by far, Bournemouth’s Vitality Stadium which boasts 11,360 seats. West Ham were only given an allocation of 2,000 seats.

Thats it for the first week of this matchday money series – any feedback would be greatly appreciated as we continue to refine the formula to get as accurate a read on matchday takings.

Please follow and like us:
error

Financial Football News Round-Up Edition 3

Financial Football News Weekly Round-Up Edition 3

Here is your weekly financial football news round-up to keep you up to date with all things financial football! This is your round-up for the week commencing 27th November 2017, featuring the Champions League, Manchester City, the London Mayor and Celtic. Stay tuned for further analysis of these developments over the coming week.

Pay day for Eagles as Allardyce Flies North

Allardyce this week joined Merseyside strugglers Everton on 18-month contract. Everton have been lifted by the announcement, recording 2 wins since Big Sam was given the job to move up the table. Also lifted by the news was Crystal Palace owner Steve Parrish, who’s club will net £2m from the deal with Allardyce triggering a clause having moved to another club after his resignation in the summer, supposedly to retire.

Santander Banks Champions League Deal

Champions League Sponsor

The Santander Bank is to become an official sponsor of the UEFA Champions League from the 2018/19 season for 3 years, joining Heineken and Nissan as part of commercial sponsorship process currently ongoing for the next 3 seasons. This is a change in sporting direction for Santander, with the deal ending their 11 year association with Ferrari in F1 racing.

West Ham, There is a New Mayor in Town…

And we are not talking about Moysey! Sadiq Khan will from this week take control of the operation of the London Stadium in a bid to get a grip with the stadium’s finances. The London Stadium deal agreed with West Ham under the former Mayor Boris Johnson’s watch, looks set to cost taxpayers £24m in 2017-2018, with West Ham paying just £2.5m-a-year to rent the 60,000 seater stadium. More analysis to follow…

Thai Airways Fly to EFL

English Football League New Sponsor

The English Football League (EFL) have announced a season-long sponsorship deal with Thai Airways, giving the airline a large stadium presence for the EFL Play-off finals at Wembley, as well as the Carabao Cup final. No figures have yet to be announced as the EFL continue to build their presence overseas. More analysis to follow…

Celtic Looking to Invest Down Under

Celtic eye A-League Investment

Scottish Champions Celtic are interested in purchasing an Australian top flight club, with Brisbane Roar and Central Coast Mariners both mooted as possible targets. The move signals a change in business strategy for Celtic as they look to build their global presence by investing in Australia and gaining first-option on any bright young players to come out of the club they acquire. More analysis to follow…

Puma pounce to sign Manchester City

Manchester City Puma Deal

Manchester City have agreed a huge £50m a year deal to replace current kit supplier Nike with Puma. The new deal represents another commercial win for the Premier League leaders, dwarfing their current £20m-a-year deal with Nike agreed in 2012. The Nike deal expires at the end of the current season and Manchester City have moved quickly to exploit their growing global presence after a strong start to the season. Further Analysis to follow…

Please follow and like us:
error