Leeds United’s 2018 Finances – New Era

Leeds United's 2018 Finances

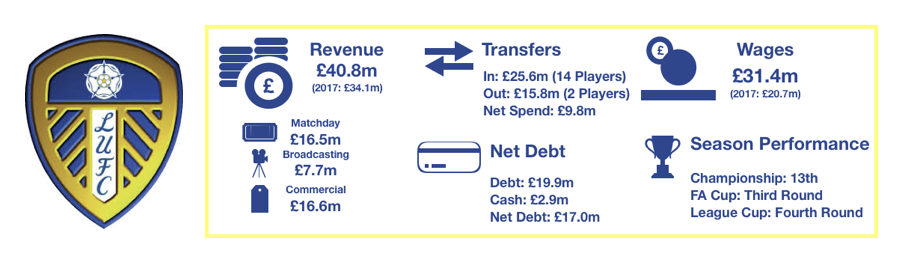
Leeds had a disappointing season in the first year since Radrizzani took over at Elland Road, finishing 13thin the Championship, condemning the club to a 9thsuccessive season away from the Premier League.

There was also disappointment in the domestic cups after early exits in both the FA Cup and League Cup.

However, optimism has been renewed due to their new ownership and the ambition he has shown to date, increasing investment in the club with much more expected to follow.

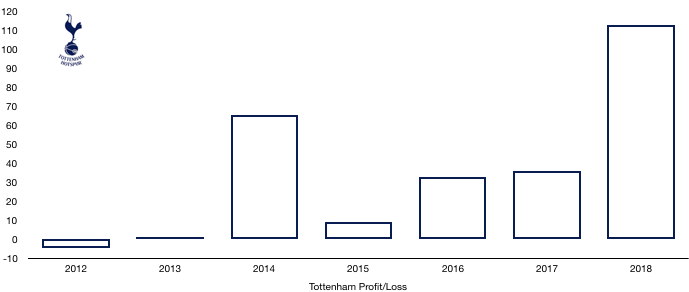
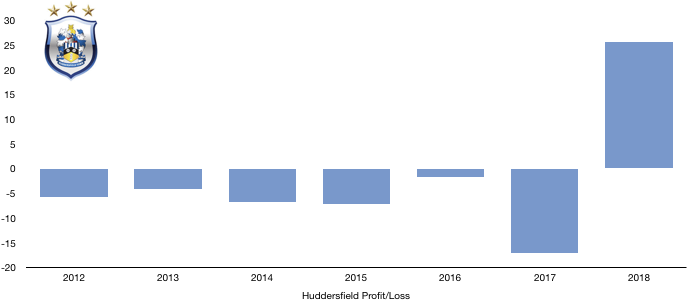
The investments made did worsen their finances, turning a profit of £1.0m to a loss of £4.3m, however with promotion in touching distance, it looks like a gamble that will pay off.

Let’s delve into the numbers.

Leeds United Profit:Loss 2018

Revenue Analysis

Leeds United 2018 Revenue

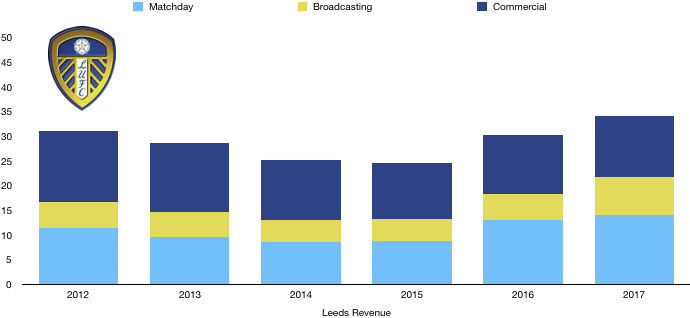
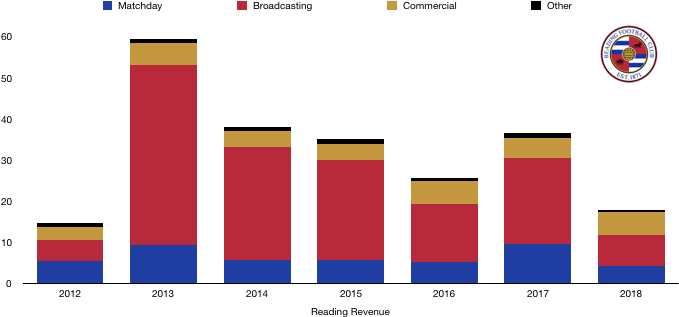
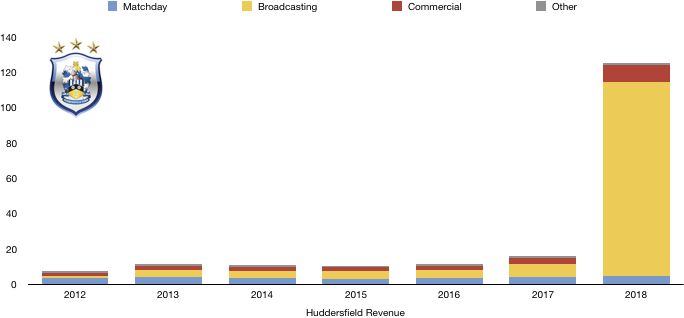
Leeds reached record levels of revenue in 2018, with revenue rising from £34.2m to £40.8m (19%).

Matchday revenue continued its upward trajectory, rising from £14.1m to £16.5m (17%) as an increase in fan sentiment saw attendances rise yet again from 27,699 to 31,521 (14%), approaching full capacity (37,980) as fans our hopeful once again of success.

It was also their second highest average attendance in their 8 year stay in the EFL.

Broadcasting revenue was relatively stable, increasing slightly from £7.6m to £7.7m (1%) despite falling 6 places in the Championship and a worse performance in the cups.

This is due to the club featuring on TV more regularly given the increased interest in the club.

Commercial revenue rose by a third, increasing from £12.5m to £16.6m (33%) as their new owner opened the doors to new, lucrative deals. This was a great season commercially as their popularity among their fans grew and in England as a whole as they close in on a Premier League return.

Looking ahead, revenue will rise after a wonderful league campaign so far. This should see revenue rise as prize money will increase and they have featured frequently on Sky Sports. 

Attendance looks likely to rise again with average attendance to date of around 33,000, so matchday revenue will also rise.

Commercial revenue should continue to increase due to the growing popularity and the aggressive commercial strategy the club have begun to implement.

Promotion will not initially boost revenue considerably, instead, should they get over the line, revenue will boom to over £100m following their first Premier League campaign.

Costs Analysis 

Leeds United Costs 2018

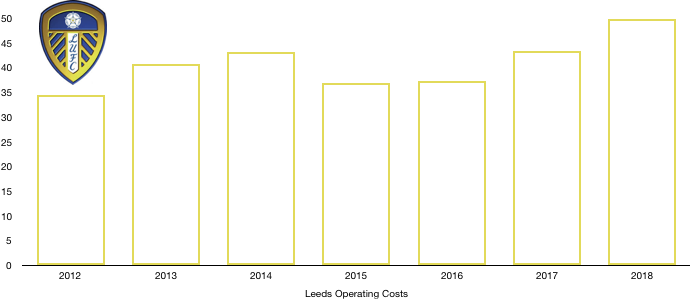
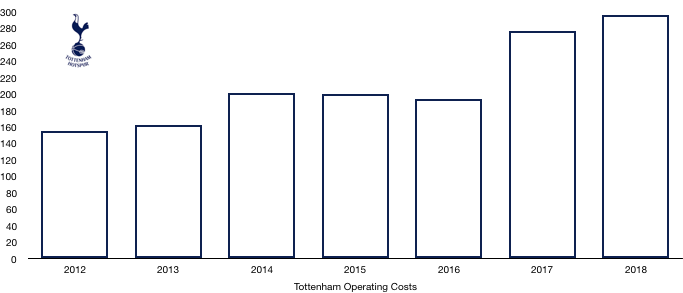
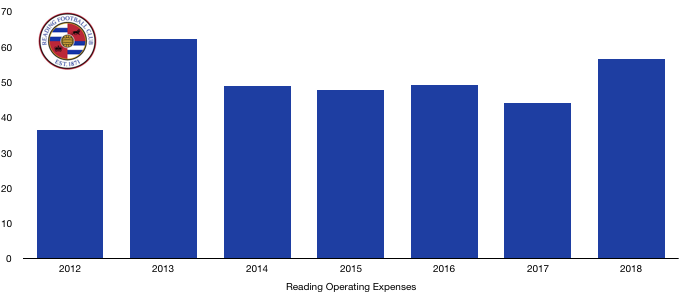
Leeds saw a significant increase in costs, with operating expenses rising from £43.3m to £61.4m (42%) after a surge in investment.

Amortisation grew from £5.4m to £8.1m (50%) after an increase in player investment after their net transfer spend grew by nearly 1,000% (see transfer analysis)!

The rise in amortisation signifies Leeds growing ambition and it is expected this will only rise going forward.

Lease costs remained relatively stable, rising from £2.1m to £2.2m (5%).

Interest costs rose from £1.5m to £1.7m (13%) due to an increase in lease interest costs. 

Leeds also had £2.6m of interest income last year due to a change in the value of their loans which wasn’t present this year, contributing to their loss.

Leeds paid no tax this year due to making a loss, this may help when they return to a profit in the next couple of years, with the loss in 2018 being able to partly offset any tax bill the club face.

Leeds United Wages 2018

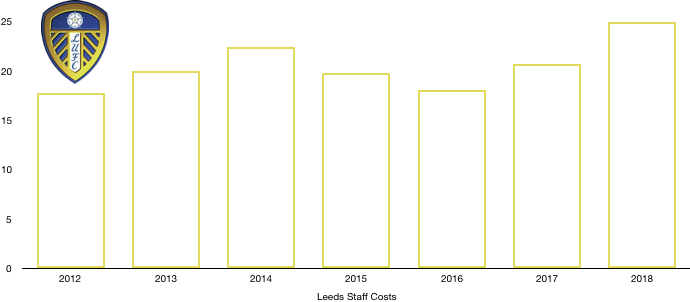
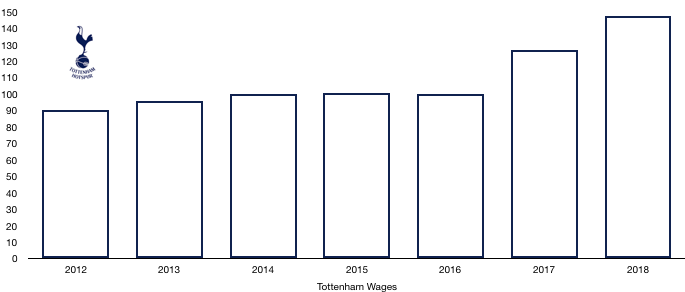
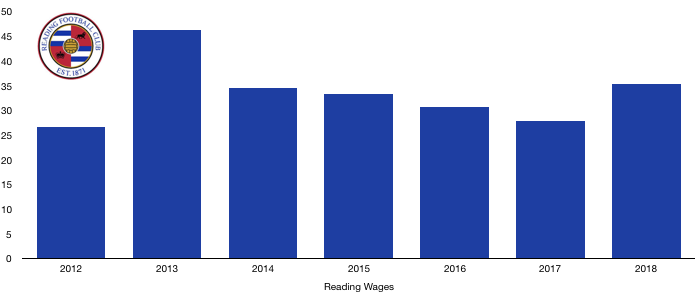
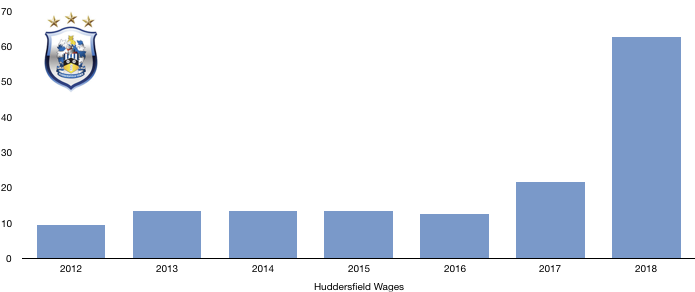
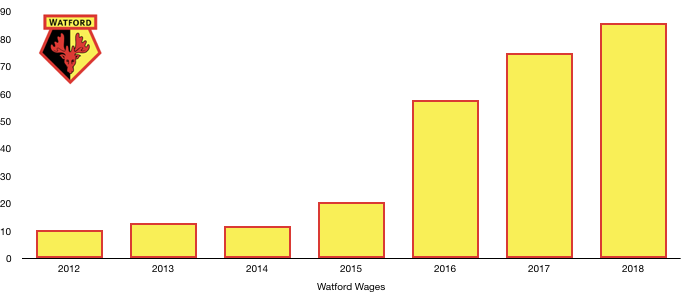
Leeds saw a huge rise in their wage bill as it increased from £20.7m to £31.4m (52%). The club signed a host of players with some new high earners, while new contracts were given to key players.

Should Leeds achieve promotion is has been disclosed they will owe players and staff £18.1m in bonuses, a sizeable sum that will increase their losses. However, from a Financial Fair Play perspective, these amounts will be ignored in any investigation (although Leeds are well within the limits so we wouldn’t expect an investigation by the EFL at present).

The extra wages equalled a sizeable extra £206k a week, a large sum for any Championship club.

Directors were paid £212k this year, however no such disclosure on remuneration were made last year.

Looking ahead, costs are likely to rise significantly after another year of spending that will see amortisation and wages rise. The extra promotion bonuses will also increase costs significantly, should they reach the promised land.

Transfers Analysis

Leeds United Net Transfer Spend 2018

What a busy transfer for Leeds! A remarkable 14 players entered Elland Road while only 2 departed.

In came (here we go) Forshaw (£4.6m), Jansson (£3.6m), Saiz (£3.2m), Roberts (£2.6m), Alioski (£2.3m), Klich (£1.5m), Sacko (£1.5m), De Bock (£1.5m), Grot (£1.4m), Cibicki (£1.4m), Ekuban (£0.5m), Ideguchi (£0.5m), Halme (£0.5m) and Wiedwald (£0.5m) for a combined £25.6m.

Out went Wood (£14.8m) and Bridcutt (£1.0m) for a combined £15.8m.

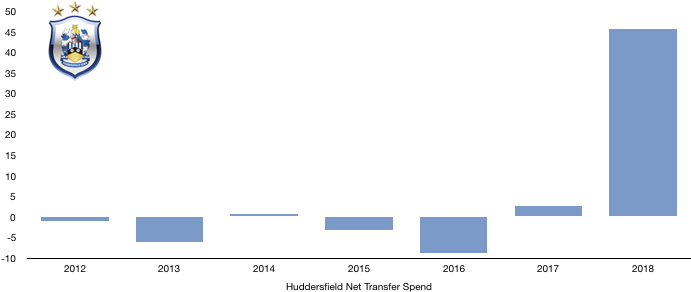
This meant their net transfer spend increased from £0.9m to £9.8m (989%), a meteoric rise in spending and a show of ambition.

However, the signings were quantity over quality with the players proving to be an incredibly mixed bag. The likes of Forshaw, Jansson and Saiz have been great while other have flattered to deceive but there is still time for them to come good.

Leeds may have been better off not spreading their £25m so thinly and focussing on signing a few great players.

The departure of Wood was clearly felt as they missed his ability towards the back end of the season.

Leeds recorded a profit on player sales of £18.1m (although this does also include the sale of Viera at the end of the season) largely due to the sale of Wood. This figure helped make sure their losses weren’t far greater. 

The lack of sales this year (also considering the sale of Viera has already been taken into account), Leeds losses are likely to be much greater this season.

In cash terms, Leeds spent cash of £19.5m while receiving cash of £16.9m, a net cash outlay of £2.6m, which is a fairly minor outlay considering the ambitions of their new owners.

Leeds are also owed a further £11.5 in transfer fees (£5.9m due this year) and owe £12.4m (£5.7m due this year), a net owing position of a measly £0.7m which is hardly going to affect future transfer plans.

There is also the potential for Leeds to owe other clubs and agents £7.1m in contingent transfer fees should certain transfer clauses be met (largely related to promotion and appearances), although it is unlikely the full amount here will ever become payable.
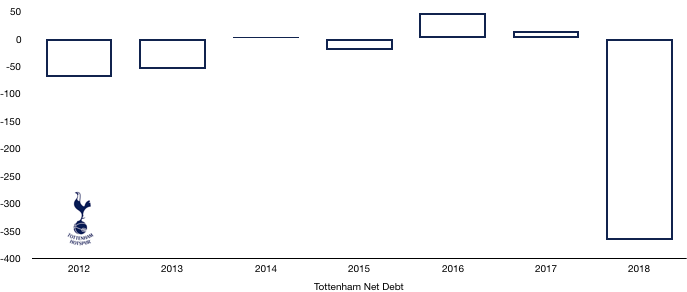
Debt Analysis 

Leeds United Net Debt 2018

Leeds saw their cash levels depleted following their losses, with cash reserves falling from £4.0m to £2.9m (28%).

Their new owners provided new funds of £13.6m (£11m in shares and £2.6m in loans). These funds were used to take care of their losses and pay transfer fees. It also allowed them to invest £3.3m in the club’s infrastructure as they look to also invest in their future as well as present.

The £11m provided by Radrizzani in shares was also used to repay existing loans in the club.

Debt levels surprisingly fell, falling from £24.6m to £19.9m (19%) as Radrizzani repaid debts owed to their old owners of around £11m and replaced these with shares of £11.0m, meaning that Leeds now owe their owners less money.

On a separate note, Leeds disclosed they are seeking legal advice on the recoverability of a £2.0m debtor, it was not disclosed what this amount relates to, but they will be hoping to recover this amount.

Net debt hence dropped from £20.6m to £17.0m (17%). There is no doubt this amount is likely to increase as Radrizzani begins pumping more money into the club. Promotion (if achieved) is likely to require significant investment (i.e. Wolves and Fulham) however it is how this is spent that will be important.

No matter how this season ends, promotion is vital in the next season or two to make any of these investments worth it. Also, if promotion is not achieved soon, Financial Fair Play limits will be tested, and the club may be forced to tone down investment and implement strict costs controls to avoid penalties.

Leeds are finally close to a return to the big time and will be hoping this season is the one. Financially they are in a good place and a return to the Premier League this season will only boost their finances in this new era.

Thanks for reading – Share with a fan! 

Please follow and like us:
error

Tottenham Hotspurs’ 2018 Finances – World Record Profits

Tottenham FC's 2018 Finances

Tottenham enjoyed another fine season in what has been a great spell for the club under Pochettino, finishing 3rdand securing another season in the Champions League while at their temporary home of Wembley.

Despite this success, Tottenham were once again called out on their lack of trophies, having failed at the Semi-Final Stage, Last 16 and Fourth Round in the FA Cup, Champions League and League Cup respectively.

However, Levy has much to be happy about having steered Tottenham to this point on a low budget, helping Tottenham record a world record profit of £113.0m, up from an already impressive £36.2m (212%).

Let’s delve into the numbers.

Tottenham FC Profit:Loss 2018

Revenue Analysis

Tottenham FC 2018 Revenue

Tottenham saw their revenue increase to record levels, rising from £309.7m to £380.7m (23%) as the club benefitted from their move to Wembley and their new Nike deal.

Matchday revenue increased significantly from £45.3m to £71.0m (57%) as the move to Wembley proved extremely lucrative for Tottenham. Average attendance more than doubled from 31,639 to 67,953 (115%), although to fill seats tickets were on average cheaper.

Broadcasting revenue increased from £188.2m to £200.7m (7%). This increase was mainly due to entering the knockout phases of the Champions League, having failed to in 2017, with UEFA prize money increasing from £38.4m to £53.1m (38%), while Premier League TV money actually fell from £150.0m to £147.6m (2%) as they dropped a place in the Premier League.

Commercial revenue grew well, rising from £76.2m to £109.1m (43%) as Tottenham replaced their deal with Under Armour (£10m per annum) with a much more lucrative 15-year deal from Nike (£30m per annum).

Looking ahead, Tottenham should see some revenue growth this year. Tottenham have played the majority of their games at Wembley again this year so matchday revenue will be relatively stable considering they will have a similar number of home games this year.

Broadcasting revenue should increase with Tottenham reaching at least the Quarter Finals of the Champions League this year. Premier League revenue is likely to fall unless Tottenham can match last seasons’ 3rdplaced finish, while they also performed worse in the FA Cup which will harm revenue in this area. Commercial revenue should also continue its upward trajectory with Tottenham’s popularity and stature continually growing.

Costs Analysis

Tottenham FC Costs 2018

Tottenham managed their costs to perfection in 2018 under strict orders from Daniel Levy. Cost rose slightly from £276.7m to £296.7m (7%). With revenue rising by 22%, keeping costs rises down to 7% is incredible considering the higher level Tottenham have maintained, this has significantly boosted profitability.

Amortisation increased from £42.9m to £57.5m (34%) after an influx of new players replaced existing players who had been at the club for some time, with the rise in amortisation signifying reinvestment. 

Amortisation is likely to fall this year following little transfer activity at the North London club.

Lease costs increased from £1.1m to £1.4m (22%).

Net interest costs fell from £21.2m to £18.1m after interest rates fell on some of their loans.

Tottenham also paid tax of £26.0m, an effective tax rate of 18% which is largely in line with the statutory rate of 19%.

Tottenham stadium is the most interesting part of their current finances and the delayed entry and spiralling costs has peaked everyone’s interest. 

At the beginning of the year, Tottenham had spent £517.5m after initially expecting this to be around the full cost of the stadium. However, this year they have had to fork out an eye-watering £514.1m due to overruns, taking the total costs of the stadium to over a billion pounds! This has considerably affected their finances and transfer plans, leading to additional loans (see debt analysis).

Tottenham FC Wages 2018

Wage control persisted this year with a stadium to pay for, but wages did still rise from £126.9m to £147.6m (18%) on the back of the new signings while their key players were rewarded with new, lucrative contracts after another excellent season.

The increase in wages works out at an extra £398k a week, the minimum Tottenham needed to remain competitive with the wage rise at their rivals surpassing this considerably.

Despite this wage rise, Tottenham are still way below their rivals with United (£295.9m), Liverpool (£263.6m), City (£259.6m), Chelsea (£245.7m) and Arsenal (£240.1m) all paying well above the wages on offer at Tottenham. 

This showcases what a great job the club are doing to remain competitive among these financial giants, highlighted even further by the fact Everton (£145.5m) pay around a similar amount in wages to Tottenham.

Director remuneration more than halved as they sacrificed in the short term due to the stadium, with remuneration falling from £9.0m to £4.2m (53%), while Levy saw his pay halved from £6.0m to £3.0m, with the previous bumper pay being due to back dated bonuses that hadn’t been paid, so his renumeration was always expected to decrease this year.

Looking ahead, Costs are likely to increase slightly next year. Wages will rise slightly due to new contracts with the only incoming or outgoing of note being Dembele, amortisation will fall due to the lack of investment. 

Costs are likely to rise a bit due to stadium maintenance costs that will now be incurred on the New White Hart Lane following the move into the stadium this week.

Profits are likely to plummet next year despite no major increase in costs or revenue as transfer sales were a major part of their profit this year, and with no major outgoings, this will hit profit considerably as will be seen in the next section.

Transfers Analysis

Tottenham FC Net Transfer Spend 2018

There has been little transfer activity since 2018 with Tottenham signing no players this season. However, 2018 was a busy transfer season for Tottenham as they signed 5 players and sold 6.

In came Sanchez (£36.0m), Lucas (£25.6m), Aurier (£22.5m), Lllorente (£13.6m) and Foyth (£11.7m) for a combined £109.4m. 

Out went Walker (£47.4m), Wimmer (£17.5m), Bentaleb (£17.1m), N’Jie (£6.3m), Fazio (£2.9m) and Jannsen (Loan – £2.3m) for a combined £93.4m.

This led to a net transfer spend of £16.0m, their second successive net spend.

Sanchez, Lucas and Aurier all proved to be class signings for Tottenham, adding quality to the squad while Llorente added depth and Foyth was one for the present and future and has shown potential.

Meanwhile, Tottenham received good fees for Walker and great fees for Wimmer and Bentaleb given the quality they showed at White Hart Lane.

Tottenham recorded a profit on player sales of £73.1m mainly due to the sales of Walker and Bentaleb and this went a long way in securing their record profit levels. Tottenham would have still been profitable without any sales which is an impressive and unusual feat.

In cash terms, Tottenham spent cash of £79.9m and received £73.8m, a net cash outlay of a measly £6.1m which is peanuts for a club the size of Tottenham.

However, Tottenham do owe a further £108.4m (£44.1m of which is due this year) and are only owed £40.2m (of which £36.1m is due this year), a net owing position of £68.2m (£8.0m this year). 

This has clearly (along with the bigger reason of their stadium) affected their transfer plans with this £68.2m needing to be paid in the coming season or two, hopefully they will have some cash to spend this summer.

There is also the further possibility of owing £14.9m to clubs/agents and £16.9m to players should certain transfer clauses be met, although it unlikely the full amount of either balance will ever become payable.

Debt Analysis 

Tottenham FC Net Debt 2018

Tottenham built up a sizeable cash balance in 2017 and this was halved from £200.1m to £100.6m (50%) due to the development of New White Hart Lane.

Increased revenue and profits and the existing cash balance were used to pay for transfers and part of the huge £492.9m cash outlay Tottenham spent this year on their stadium.

This amount was nowhere near enough, so Tottenham needed new loans of £279.4m to help fund this.

Debt hence more than doubled from £185.5m to £466.3m (151%) on the back of the huge new loans needed to fund the stadium and its inevitable overruns.

Investec have loaned Tottenham £21m until 2022 as part of their stadium funding.

However, the main bulk has come from a consortium of HSBC, Goldman Sachs and America Merrill Lynch who have provided £445.3m so far, with Tottenham having the ability to increase this to £537m. All amounts are due to be repaid by 2022, which is only 3 years away and seems a push that it will all be repaid by then (it will most likely be renegotiated or refinanced elsewhere).

The average interest costs across these loans is around 3%.

Levy has pledged £50m of loans as well should it be needed, although this hasn’t been touched yet.

Tottenham hence moved from a net cash position of £14.6m to a huge net debt position of £365.7m as would be expected given the scale and ambition of their new stadium.

This represents a huge change in the debt profile of Tottenham however this stadium is going to pay dividends going forward, increasing matchday income and generating considerable commercial opportunities.

The key now is to guarantee Champions League football next season, because without it, repaying the stadium loans will become more difficult and stretch their budget further, hurting any ability to bring in new players the club desperately need to remain competitive.

It remains to be seen the full effect a demotion to the Europa League football would have, and it’s not a thought Tottenham fans or Daniel Levy even want to contemplate.

Thanks for reading – Share with a friend!

Please follow and like us:
error

Blackburn Rover’s 2018 Finances – Rovers In Red

Blackburn had to endure a season in League One following relegation in 2017, but immediately bounced back to the Championship via automatic promotion following a second-placed finish.

A season in League One for a team not used to being that far down the football pyramid will no doubt have a significant financial impact and it did. Blackburn saw their losses more than triple, increasing from £5.2m to a sizeable £16.8m.

Despite this increased loss and the growing Financial Fair Play concerns, promotion back to the Championship should calm down these concerns as their finances should begin to improve.

Let’s delve into the numbers.

Blackburn Profit:Loss 2018

Revenue Analysis

Blackburn 2018 Revenue

Blackburn unsurprisingly saw a steep fall in revenue following their relegation, with revenue falling from £16.1m to £9.0m (44%).

Matchday revenue dropped from £3.3m to £2.8m (15%). This was despite average attendances actually increasing from 12,688 to 12,832 (1%), indicating a fall in ticket price due to the lower standard in League One. Attendance of 12,832 is still well below the full capacity of 31,367 at Ewood Park, so there is plenty room for growth in this area, although a return to the Premier is probably needed for any of this to be realised.

Broadcasting revenue plummeted, falling from £7.9m to a measly £1.9m (76%) after a huge reduction in the prize money received in League One, showcasing the importance of at least remaining in the Championship for Blackburn.

Commercial revenue fell from £4.4m to £4.3m (2%), proving relatively robust despite relegation with the majority of sponsors remaining with the club. Blackburn will be hoping that since they managed to maintain commercial revenue following relegation, a return to the Championship will enable commercial revenue to grow.

There was no other revenue in 2018 (2017: £0.5m).

Looking ahead, Blackburn will obviously see a huge increase in revenue back to around 2017 levels, hopefully higher. Blackburn look likely to remain in the Championship so will therefore finish higher than they did in 2017. Prize money has also increased since then so broadcasting revenue should be £8m at the minimum. Average attendances have increased so matchday revenue is likely to be around £4m while commercial revenue could increase to around £5m.

All in all, revenue should be between £17-20m, around double revenue this year.

Costs Analysis

Blackburn Costs 2018

Blackburn managed to reduce costs following relegation, decreasing them from £34.1m to £26.5m (22%). Despite cutting costs well, the fall in costs was half that of revenue, hurting profitability considerably, hence the large loss.

Amortisation increased slightly, rising from £0.7m to £0.8m (14%) after spending in the summer, having not signed anyone in 2017 for a transfer fee.

Interest costs dropped a third from 0.6m to £0.4m (33%) due to a smaller overdraft while other interest costs also fell slightly.

Blackburn paid no tax due to making a loss, a situation which will continue for the foreseeable future in all likelihood.

Blackburn Wages 2018

Wages fell a quarter from £22.6m to £16.8m (26%) as high earners departed the club following relegation. Relegation wage drop clauses would have also come into effect, reducing existing players salaries considerably.

Blackburn managed to cut wages well, saving roughly £112k a week, a nice saving for anyone!

Directors interestingly saw their renumeration increase significantly, rising from £166k to £282k (70%) despite relegation. It is possible these include bonuses from promotion last season which would make more sense. They may have also been rewarded for the financial savings made that helped restrict the losses to what they were (despite how large they appear to be).

Looking ahead, costs will rise following promotion, not only has spending increased (increasing wages and amortisation) but promotion wage clauses will also see wages rise (plus new contracts).

Transfers Analysis

Blackburn Net Transfer Spend 2018

It was a fairly quiet transfer window for Blackburn as three players arrived at Ewood Park and 2 departed.

In came Dack (£0.8m), Samuel (£0.5m) and Bell (£0.3m) for a combined £1.5m (rounds down).

Out went Steele (£0.5m) and Brown (£0.2m) for a combined £0.7m.

This led to a low net transfer spend of £0.8m following two years of sizeable negative net spends.

Dack proved to be one of the signings of the season across all 4 top divisions in England and was a major reason for their promotion. Samuel and Bell both contributed as well to the expected but still impressive promotion.

Blackburn also recorded a profit on player sales of £1.1m, although this includes the sale of Marshall at the end of the season as well.

In cash terms, Blackburn spent cash of £1.1m and received cash of £0.7m, a net cash outlay of £0.4m, not much to write home about.

Blackburn owe a further £1.3m in transfer fees, however this is completely cancelled out by the fact that are also owed £1.3m (£1.2m of which is due this year), so this should have no impact on future transfer plans.

Blackburn could also have to pay players, agents and other clubs a further £2.1m in transfer fees should certain clauses be met.

Interestingly, Blackburn also disclosed that they paid players £0.8m cash to leave the club following relegation. This is likely to have been paid to the likes of Akpan, Lowe and Stokes, all who left on free transfers following relegation.

Debt Analysis

Blackburn net debt 2018

Blackburn saw their modest cash levels double from £0.2m to £0.4m (100%) despite sizeable losses. Their owners provided new loans of £13.9m to fund these losses and pay for those players who were released.

Blackburn also spent £0.4m on infrastructure, the same level as last year. Blackburn should aim to increase this to better invest in their long-term future.

Debt levels rose from £106.7m to £120.4m (13%) after new loans of £13.8m from their owners, while their overdraft fell by £0.1m to £1.7m.

These new loans were necessary due to relegation, although they may also need further investment following promotion to be competitive in the Championship and even more so should they wish to make an overdue return to the Premier League.

Net debt increased then from £106.5m to £120.0m (13%). The level of ambition of their owners is important now. Should they wish to consolidate as a Championship side, some investment is needed, however they should become self-sufficient fairly quickly.

Should they wish to make a return to the Premier League significant investment will be needed, although this may be restricted due to Financial Fair Play.

Blackburn have made cumulative losses of £40.7m over the last 3 years, which is around the upward limit allowable. They should be okay as long as their losses next year don’t exceed £20m, meaning the club cannot go too wild even if their owner wants to.

They could still be in trouble due to financial Fair Play issues from 2015 where their 3-year cumulative losses were an astronomical £98m. It remains to be seen whether sanctions have already been agreed in relation to these as they were a few years ago and they were punished in 2013 for Financial Fair Play transgressions.

Thanks for reading – Share with a Blackburn fan!

Please follow and like us:
error

Reading FC’s 2018 Finances – Royals Flushed

In the famous words of Drake, Reading went from 100 to zero real quick (not quite right is it?), going from the play-off final to 20th in one season, narrowly avoiding relegation.

After nearly gaining promotion last year, a poor season cost Manchester United legend Jaap Stam his job although things haven’t really improved since his departure.

A poor cup campaign further dampened spirits in a disappointing season.

A demoralising season was just as poor off the pitch as a £4.7m profit in 2017 turned into a £21.0m loss in 2018 following the receipt of their final parachute payment last year.

Let’s delve into the numbers.

Reading Profit:Loss 2018

Revenue Analysis

Reading 2018 Revenue

Reading saw their revenue halved from £36.7m to £17.9m (51%) following a poor season that saw fans turn away from the club.

Matchday revenue more than halved from £9.7m to £4.2m (57%) as fans left in droves as their performances on the pitch plummeted. A fall in attendance only partly explains the fall in revenue as average attendance only fell from 17,481 to 15,181 (13%), meaning ticket prices must have fell or the ticketing strategy was a poor one.

Broadcasting revenue fell from £20.9m to £7.5m (64%) as Reading dropped 17 places in the Championship. This free-fall was compounded by the fact they no longer receive parachute payments for their relegation from the Premier League five years ago that helped prop up their finances.

This means that Reading are officially back to being a normal Championship side and are now on the same financial playing field as the majority.

Commercial revenue surprisingly increased from £4.8m to £5.6m (17%) as Reading managed to increase their income on the back of the memorable 2017 season. It remains to be seen whether this level of commercial revenue can be maintained after the season they just had (and are having this year).

Looking ahead, Reading will see a similar level of revenue this year, with the deciding factor being their final league position. At the time of writing, Reading are 19th, one places above last season’s 20th placed finish. Should they climb or fall, this will impact their broadcasting revenue, while relegation would have a long-term impact on their revenue and finances in general.

Costs Analysis

Reading Costs 2018

Reading saw a sizeable increase in costs despite falling revenue, hurting profitability considerably. Costs rose from £44.2m to £56.7m (28%).

Amortisation more than doubled, rising from £3.7m to £8.2m (122%) on the back of significant player investment, relative to recent levels. This investment has yet to pay any dividends with performances worsening rather than improving.

Reading incurred lease costs of £0.2m, an amount that will increase following the sale and lease back of the Madejski stadium (see debt analysis for more details).

Interest costs fell to almost zero, decreasing from £2.2m to £0.2m. This was mainly due to £1.2m of costs relating to arranging loans last season that weren’t present this year. General loan interest expenses fell as well.

Reading paid no tax this year having incurred a large loss, this is likely to be the case for the foreseeable future given their revenue and costs currently.

Reading Wages 2018

Wages rose from £37.9m to £35.3m (27%) after the signing of new higher-earners, while new contracts were rewarded to the players who performed so well in 2017.

There would also have been severance payments to Jaap Stam and his staff, although these haven’t been disclosed.

The wage increase works out at a sizeable extra £142k a week, a figure that is going to have to be reversed following a couple of poor seasons that have stretched their finances.

Directors were rewarded for their 2017 performance in 2018, as their renumeration increased from £0.7m to £1.4m, despite a poor season. It remains to be seen whether this will fall back to 2017 levels given the poor season the club are having.

Looking ahead, costs are likely to remain at a similar level, although they really do need to begin controlling their costs too avoid financial fair play issues as their losses mount. A second successive poor season is likely to be the catalyst to a cost reduction strategy, with high-earners likely to depart, while transfer spending will also fall.

Transfers Analysis

Reading Net Transfer Spend 2018

Reading had a busy season in the transfer market as they signed 5 players and sold 3, spending the largest amount they have done in over 6 years.

In came Aluko (£6.8m), Mannone (£2.1m), Barrow (£1.5m), Bacuna (£1.4m) and Edwards (£1.0m) for a combined £12.7m.

Departing the Madejski stadium were Beerens (£0.9m), Samuel (£0.5m) and Hurtado (£0.5m) for a combined £1.9m.

Reading’s net transfer spend hence increased from £2.7m to £10.8m (300%) as they recorded their largest net spend in recent memory.

The signings were meant to push the club on having narrowly missed out on promotion, however they did the opposite with none of the players (bar Barrow) impressing.

Reading did at least manage to record a profit on player sales of £1.4m. They also hold sell-on clauses on 9 players being McCarthy, Novakovitch, Fosu, Cooper, Norwood, Beerens, Samuel and Al Habsi that may bring some money into the club soon.

In cash terms, Reading spent a heavy cash load of £19.2m as they had to pay for transfers from previous seasons. In contrast, Reading only received £2.0m of cash in 2018, a net cash outlay of £17.2m.

It doesn’t get any better financially as Reading still owe £6.9m (all of which is owed this year) and are only owed £0.5m. This £6.4m owed needs to be funded and will further constrain any future transfer plans.

Reading may also potentially owe players, clubs and agents a further £12.9m in contingent transfer fees should certain clauses be met, although it is unlikely all of this will ever become payable.

Debt Analysis

Reading Net Debt 2018

A poor season for Reading ended in the need for cash to fund their spending (which was meant to be funded by a return to the Premier League).

Cash levels remained low, falling from £1.1m to £0.7m (36%) as their losses were funded via three main sources: new shares issued by their owners (£15.8m), new loans from their owners (£3.2m) and the sale and leaseback of the Madejski stadium (£26.5m). These funds were used to pay for transfers, fund their losses and invest in their infrastructure (£1.1m).

The sale and leaseback of the Madejski stadium for £26.5m to their owners is a short-term measure to provide funding. What it does is at least give their owners something in return for their investment. The lease is £750k a year until 2043. The value of the stadium hasn’t been disclosed so it is uncertain whether this was a fair deal for Reading or not. It is likely that following the lease ending in 2043, the Madejski stadium will return to the ownership of the football club.

Debt levels increased from £58.4m to £61.2m (5%) after the owners lent a further £3.2m to the club. The owners also gave Reading funds of £15.8m by issuing new shares, Reading will not have to repay their owners this money. Looking ahead, unless costs are cut it is likely further funding will be necessary.

Net debt hence increased from £57.3m to £60.5m (6%). The increase is not big but masks the fact that they received £15.8m in share issues and also had to sell and lease back their stadium.

With their parachute payments running out and a return to the Premier League looking remote currently, Reading’s financial health will only deteriorate further unless significant financial changes are made or there is a surprise upturn in performances on the pitch.

Thanks for reading – Share with a Reading fan!

Please follow and like us:
error

Huddersfield Town FC’s 2018 Finances – Premier Profits

Huddersfield Town FC's Finances 2018

Huddersfield enjoyed another memorable season, beating the odds to secure Premier League survival with a 16thplaced finish, just a season after an unexpected promotion. 

Huddersfield were expected to finish rock bottom given their modest budget and the surprise they were promoted in the first place, but they made all their fans proud in their first season in the Premier League.

An inaugural Premier League campaign turned a £17.1m loss in 2017 into a record-breaking £25.7m profit for the club, showing the riches the Premier League brings.

Let’s delve into the numbers.

Huddersfield Profit:Loss 2018

Revenue Analysis

Huddersfield 2018 Revenue

Revenue shot into the stratosphere for Huddersfield, rocketing from £15.8m to £125.2m (692%) as they benefitted for the riches available in the Premier League.

Matchday revenue increased from £4.0m to £4.8m (20%) as fans flocked to the John Smith’s Stadium and ticket prices rose slightly.

Broadcasting revenue increased 12-fold, rising from £7.5m to an eye-watering £109.8m (1,364%!) as Huddersfield saw first-hand the riches the Premier League brings and why clubs fight tooth and nail to get to the top flight and to stay there.

Huddersfield also performed slightly better in the cups which added to their prize money pot.

Commercial revenue nearly tripled, increasing from £3.4m to £9.7m (185%) as the club exploited their new Premier League status to good effect and will be hoping they can maintain this despite relegation.

Other revenue was stable at £0.9m.

Looking ahead, Huddersfield are relegated however their revenue next season should remain fairly stable. Finishing 3 or 4 places lower than last season will hit the club by around £6-10m, however commercial revenue may offset much of this drop. 

The real drop will be felt next year when they play in the Championship and are likely to see revenue drop by at least a third as they will receive around £8m from the Championship in revenue and then further parachute payments.

Costs Analysis 

Huddersfield Costs 2018

Huddersfield saw their costs more than double from £38.5m to £103.6m (169%) as they invested relatively heavily to make themselves Premier League ready. However, this rise in costs paled in comparison to the huge increase in revenue, boosting profitability significantly.

The increase in costs is even more pronounced when considering that they had exceptional one-off costs of £11.9m related to gaining promotion last season.

Amortisation costs increased from a measly £2.7m to £17.1m (533%) as the club, who are used to relatively quiet transfer windows, experienced the largest transfer season in their history. 

Huddersfield also had an impairment charge on existing players values of £1.5m.

Interest charges increased from a minimal amount to £0.5m due to interest on transfer fees paid by instalments.

Huddersfield Wages 2018

Huddersfield’s wages nearly tripled, rising from £21.7m to £62.6m (188%) as the club paid their new players at Premier League rates while existing players were rewarded with lucrative new deals. 

Huddersfield are likely to have also rewarded players in spades for securing survival.

This wage increase works out at a huge extra £787k per week, an astronomical amount. However, to put this into perspective, this is still the lowest wage bill in the Premier League, showcasing the amazing feat they achieved in surviving.

Directors were rewarded as their wages increased from £291k to £664k (128%).

Looking ahead, Huddersfield will see a further increase in costs next season as the club spent relatively heavily again then they are used to. Huddersfield will be hoping that wages do then drop significantly next season as wage drop clauses come into effect and high-earners leave following relegation.

Transfers Analysis

Huddersfield Net Transfer Spend 2018

Huddersfield had the biggest transfer year in their history, spending £51.1m to bring in 9 players.

In came Mounie (£11.7m), Pritchard (£11.1m), Ince (£8.2m), Mooy (£8.2m), Malone (£3.5m), Depoitre (£3.4m), Zanka (£2.4m), Sabiri (£1.4m) and Kachunga (£1.2m) for a combined £51.1m.

Out went Wells (£4.9m) and Dempsey (£0.4m) for combined £5.3m.

This meant their net transfer spend increased from a measly £2.7m to a huge £45.8m (1,596%), only their third net transfer spend in the last 7 years.

The signings all did their bit to secure survival with Mooy proving one of the signings of the season while Mounie offered some goal threat and Pritchard boosted the club just when they needed it following his winter move.

Huddersfield also secured a profit on player sales of £5.9m, although this amount also includes the sale of Ince to Stoke.

In cash terms, Huddersfield spent actual cash of £39.0m while they only received £2.5m, a net cash outlay of £36.5m.

They are however owed a further £7.4m (of which £4.5m is due this year) but owe £14.6m (of which £11.5m is due this year), meaning they owe £7.2m net, an amount that should not affect future transfer plans.

Huddersfield also have contingent transfer fees payable if certain clauses are met. A potential £4.6m is payable to players while they could also be forced to fork out an additional £2.1m to agents.

Debt Analysis

Huddersfield Net Debt 2018

Huddersfield’s finances were significantly boosted by the Premier League and this was reflected in their cash balance more than doubling.

Cash reserves increased from £3.0m to £6.5m (117%) due to the profits made on promotion. £5.1m was used on a new training ground at PPG Canalside and stadium enhancements, with a further £0.7m on other improvements. This £5.8m infrastructure investment was up from only £1.1m last year, showing the long-term outlook Huddersfield have sensibly chosen.

In the process of counting all their new cash, Huddersfield actually repaid some loans owed to their owner.

Debt levels fell from £53.1m to £50.2m (5%) as the owner rewarded himself with a job well done this year, repaying himself £2.9m.

This repayment may soon be back with the club following another heavy transfer window that may require funding, while relegation is unlikely to see him repay himself again anytime soon.

Net debt hence fell from £50.1m to £43.7m (13%) after the increase in cash and decrease in debt. 

Huddersfield are still in a good place financially despite relegation this season due to the prudence they showed in their two year stay. This means that the club should be okay if their stay in the Championship is prolonged, although a quick return would be welcome, and they are well positioned financially to do this.

A return within the next two seasons would mean their financial approach wouldn’t have to change too much as parachute payments should assist their transition to the Championship. 

Any longer and further investment will be needed to avoid a much longer stay in the Championship becoming their reality.

Thanks for reading – Share with a Huddersfield fan!

Please follow and like us:
error

AFC Bournemouth 2018 Finances – Howe You Doin’?

AFC Bournemouth Finances 2018

Bournemouth had another solid season in the Premier League, securing their 4thsuccessive season in the top flight following a 12thplaced finish. A Quarter-Final finish in the League Cup partly made up for the club failing to follow up on last season’s top half finish.

2018 saw Bournemouth begin to flex their growing financial muscle, breaking the £20m transfer fee barrier for the first time.

The added investments made led to a £14.0m profit in 2017, turning into a £10.6m loss in 2018, a sizeable swing and their first loss since 2015.

It is worth noting that the figures below are not a direct comparison as 2017 was an 11-month period for Bournemouth who changed their financial year last year. The effect of this was larger on costs than revenue due to most of their revenue being received in that 11 month period, whereas costs were affected far greater, making the increase in costs seem greater than they actually were.

Let’s delve into the numbers.

Bournemouth Profit:Loss 2018

Revenue Analysis

Bournemouth 2018 Revenue

Revenue dissapointingly fell a bit, falling from £136.5m to £134.9m (1%).

Matchday revenue did rise however, increasing from £6.5m to £6.8m (5%) on the back of another impressive season full of good performances. Bournemouth also benefitted from more home games this season after their League Cup campaign yielded 2 additional home games.

Broadcasting revenue dropped from £124.5m to £119.5m (4%) after Bournemouth fell 3 places in the Premier League and this lost revenue couldn’t be offset by their cup performances. This showcases the importance of their Premier League position to their revenue and the club will be hoping they can improve on their 12thplaced finish this season.

Commercial revenue increased significantly, rising from £4.7m to £8.1m (72%) after the club’s commercial strategy paid dividends as they exploited their fairly secure Premier League status. Bournemouth will be hoping they can build on this going forward.

Other revenue fell from £0.8m to £0.5m (38%).

Looking ahead, Bournemouth are likely to see a similar level of revenue next season. Bournemouth’s cup campaigns once again faltered early while they are due to finish around the same position as last year this year. The final league position is likely to dictate whether revenue rises while another jump in commercial income would be welcome and could boost revenue significantly.

Costs Analysis

Bournemouth Costs 2018

Costs increased significantly (even if the longer period is taking into account), rising from £121.4m to £153.1m (26%). Such a rise when revenue was falling hurt Bournemouth’s profitability hugely.

Amortisation was a big mover, rising from £19.6m to £26.9m (37%) on the back of a large increase in player investment as Bournemouth begun to kick on in the Premier League as their ambitions changed.

Lease rental costs fell slightly from £0.9m to £0.8m (11%).

Bournemouth saw their interest costs increase from £1.5m to £1.8m (20%) due to an increase in interest costs on transfer fees paid by instalments.

Bournemouth had no tax to pay due to their loss-making status this year. The loss will also help reduce future tax bills on future profits as the loss could be offset against these profits.

Bournemouth Wages 2018

Bournemouth’s wage bill ballooned this year, rising from £71.5m to £101.9m (43%) as Bournemouth broke the £100m wage bill barrier for the first time. Players were rewarded for another solid season with new contracts, while Begovic and Ake commanded premium wages.

The increase in wages works out an eye-watering £585k extra a week, unheard of for a club the size of Bournemouth, showcasing how far they have come in such a short period of time.

Directors saw their wages rise from £1.4m to £1.7m (21%) after meeting their objectives for the season.

Bournemouth also saw ‘income’ of £2.8m in relation to their 2014/15 Financial Fair Play fine of £7.6m from the EFL. After a long back and forth with the EFL, Bournemouth settled the penalty at £4.8m. Having already recorded the expense previously at £7.6m, they have been able to recognise income of £2.8m to reflect the fall in the charge.

Looking ahead, Bournemouth are likely to see another rise in costs as Bournemouth continue to push ahead and show their new financial muscle. A record transfer season in 2018/19 will see both wages and amortisation rise.

Transfers Analysis

Bournemouth Net Transfer Spend 2018

Bournemouth had a rather quiet 2017/18 transfer season with two signings and no departures.

In came Ake (£20.5m) for a record transfer fee and Begovic (£10.4m) for a combined £30.9m.

With no outgoings this meant their net spend increased from £13.7m to £30.9m (126%) showcasing the increased ambition Bournemouth have shown having consolidated their position as a Premier League club.

Bournemouth went for quality over quantity and it paid dividends as Ake and Begovic both slotted in as key players for the Cherries.

Bournemouth also received £5.2m in loan fees and wages for the likes of Afobe, Grabban and Gradel.

In cash terms, Bournemouth spent cash of £37.9m and received only £6.3m (due to previous season transfers), a net cash outlay of £31.6m.

On top of this, Bournemouth are owed £11.2m in transfer fees while they owe a further £37.5m (of which £26.5m is due this year). This means that Bournemouth owe net £26.5m in transfer fees, although this seems to not have affected their transfer dealings this season.

There could also be a further hefty charge of £29.5m if certain clauses are met in the future. £5.9m of this relates to transfers which will be owed to other clubs while £23.6m is potentially due to Bournemouth players and their agents.

Debt Analysis

Bournemouth Net Debt 2018

Bournemouth are excited at the new era they are entering where they have more financial power behind them. 

The added spending this year saw cash levels fall from £12.7m to £7.7m as their net transfer outlay (31.6m) plus the purchase of new training ground land for development (£3.8m) were funded by Mr Demin who plunged new loans of £16.7m.

The new loans led to debt levels increasing from £52.6m to £69.3m (32%) as Mr Demin showed his new level of ambition have successfully stabilised the club in the Premier League.

All the loans are interest-free and are likely to increase this season as spending continues to grow, this will require further loans to fund their increased transfer activity and the new training ground that is to be built.

Net debt hence increased from £39.9m to £61.6m (54%) as the club look to push forward. The big area the club need to consider for further investment is a new stadium or a stadium expansion due to the constraints their current stadium of 11,000 holds over the club, Bournemouth have the lowest matchday revenue by a distance in the Premier League (it is also less than a lot of Championship clubs).

Bournemouth are in a good place currently, having prudently managed their finances while they adjusted to life in the Premier League and now feel at home and able to invest more heavily without risking their financial future. 

As long as Bournemouth continue to invest smartly and keep hold of Howe, relegation doesn’t seem a worry and they should continue to improve financially, although they should keep a watch on their rising costs which are hurting profitability.

Thanks for reading – Share with a Bournemouth fan!

Please follow and like us:
error

Ipswich Town FC’s 2018 Finances – Out of Gas

Ipwich Town's Finances 2018

Ipswich had another steady year in 2018, finishing 12thin what was their 16thconsecutive season in the Championship 

It was a disappointing cup year with Ipswich not progressing past the third round in either competition.

Fans were not happy about yet another year in the Championship and the playing style of the team, with it all coming to a head with Mick McCarthy’s shock resignation.

Things haven’t improved this season with relegation looming which would affect finances going forward which are already not in a great state.

Losses increased by 21% to £5.2m, the third consecutive year Ipswich have recorded a loss.

Let’s delve into the numbers.

Ipswich Profit:Loss 2018

Revenue Analysis

Ipswich 2018 Revenue

Ipswich saw stable revenue, falling ever so slightly from £17.3m to £17.2m (1%), showcasing how stagnant the club have become even financially.

Matchday revenue fell from £5.1m to £4.7m (8%) due to attendances falling from 16,980 to 16,272 (4%) as fans became bored with a timid playing style and the same-old results. This was showcased by season ticket sales at the beginning of the season falling from 12,022 to 10,144 (16%), although this may have partly been a new ticketing strategy.

Broadcasting revenue increased from £7.8m to £8.1m (4%) after an increase in distributions from the EFL and the fact Ipswich finished 4 places higher than the previous season.

Commercial revenue remained stable at £4.4m as the club managed to retain existing deals but were unable to broker any significant new ones.

Looking ahead, a difficult season looks like ending in relegation will see a drop in revenue as broadcasting revenue falls due to less EFL prize money. Matchday revenue will fall as attendance once again drops while the loss of their Championship status would see commercial revenue drop. However, the full effect of relegation would be felt in the following season when they receive League One TV money rather than Championship money which would see a drop of at least 60%.

Costs Analysis

Ipswich Costs 2018

Ipswich saw costs rise despite stable revenue, hurting profitability significantly. Operating costs rose from £20.5m to £25.7m (25%).

Amortisation rose from £0.7m to £1.1m (57%) after Ipswich invested relatively heavily (considering previous transfer windows) to try and revitalise the club from their sombre state.

Interest costs, you guessed it, remained stable at £0.6m, decreasing by £12k in total.

Ipswich had no corporate tax to pay due to making a loss last year.

Ipswich Wages 2018

Wages were the main area where costs grew, increasing from £17.8m to £18.5m (4%) as their new signings attracted slightly higher wages. Wages make up the majority of their costs at 72%.

To put it into context though, these extra wages costs Ipswich an extra £13k a week, a minor sum.

Surprisingly, directors saw their wages increase from £76k to £130k (71%) despite an average season.

Looking ahead, Ipswich are likely to see a drop in costs regardless of whether they retain their Championship status. The sale of key players this year will see wages drop, while if they get relegated they will also see wages drop as relegation wage-drop clauses come into effect.

Transfers Analysis

Ipswich Net Transfer Spend 2018

Ipswich were busier than usual in the transfer market, bringing in 5 players in what was their biggest transfer outlay in years.

In came Huws (£1.0m), Garner (£1.0m), Waghorn (£1.0m), Drinan (£0.1m) and Cotter (£0.1m) for a combined £3.2m.

The only departure was Kieffer Moore for £0.8m.

This led to a net transfer spend of £2.4m their biggest since 2013 (which was also the last time they had a net spend).

Ipswich sold Adam Webster to Bristol City on the 28 June 2018 (just before their financial year ended on 30 June 2018) which along with the sale of Moore helped Ipswich record a profit on player sales of £3.8m. Webster was not included above as it relates more to the 2018/19 season that to this one.

The signings by Ipswich showed promise with Waghorn being a great buy who was sold to Derby for more than £5m this season. Huws seemed a good buy while Garner was also decent for Ipswich before leaving for Wigan.

In cash terms, Ipswich spent cash of £1.4m and received cash of £1.4m, meaning they pretty much broke even.

Ipswich are also owed a further £3.4m (most probably in relation to the sale of Webster) while they only owe £1.1m in transfer fees to other clubs (of which £0.6m is due this year). This should be useful in providing funds for future investments or too cushion relegation should the worse materialise this season.

Ipswich could potentially owe another £0.6m in transfer fees should certain clauses be met, although it is unlikely the full amount would be realised, and even if it did the amount is minimal and unlikely to affect their long-term finances.

Debt Analysis

Ipswich Net Debt 2018

Ipswich remained in a very similar position to last year, the club had minimal cash in their coffers as all cash received from revenue and transfers was used to pay their transfer fees and cover the increased costs. 

Increased costs were also partly funded by new loans of £6.1m, while their financial plight saw club investment stifled, as club facilities investment spending fell from £0.5m to £0.2m (60%).

Debt rose from £89.3m to £93.2m (4%) after new loans were provided by companies owed by Marcus Evans with interest rates varying from 0% to 7%.

Debt levels have remained around £86m for some time as Marcus Evans refuses to invest more heavily in the club that desperately needs revitalisation following years of stagnating.

Net debt hence increased from £89.3m to £93.2m (4%).

Rumours have been rife that Marcus Evans is open to a sale of Ipswich, with a price of £35m mooted, although this has been denied by the club.

Evans is deeply fond of Ipswich having grown up in Suffolk and is said to be only willing to sell the club to someone who has the finances to take the club forward.

With relegation looming, the value of Ipswich is likely to have plummeted making any sale difficult. Relegation may be just the tonic Ipswich need to get out of their 16-year Championship slumber and restructure the club to then move forward.

The finances have been poor for some time, losing on average of £6m a year which will only increase with relegation and may require further investment soon from Evans or elsewhere going forward to avoid financial disaster. Financial Fair Play unlikely to be an issue currently with the losses within the limits allowed.

Thanks for reading – Share with an Ipswich fan!

Please follow and like us:
error

Wigan Athletic’s 2018 Finances – Wigan’s Woes

Wigan Athletic's Finances 2018

Wigan secured an immediate bounce back to the Championship following an unexpected relegation last year by winning League One. 

Promotion was the minimum expectation and Wigan met this challenge successfully to avoid financial ruin.

An FA Cup Quarter Final run was a further highlight to a good season that gave fans renewed optimism going into 2019.

Relegation was however costly for Wigan, increasing their losses from a measly £1.6m to an eye-watering £27.6m (1,000%!).

Let’s delve into the numbers.

Wigan Profit:Loss 2018

Revenue Analysis

Wigan 2018 Revenue

Wigan saw a huge drop in revenue as it fell from £27.2m to £9.3m (66%).

Matchday revenue dropped from £3.0m to £2.1m (30%) as Wigan suffered from lower attendances at games and also from cheaper tickets. This is despite having more home games as their FA Cup campaign yielded 6 home ties.

Broadcasting revenue fell off a cliff, free-falling from £20.2m to only £3.1m (85%). This drop was more pronounced then the majority of relegations from League One to Championship due to the fact that Wigan were receiving their final parachute payment during the 2016/17 season.

This meant that not only did broadcasting revenue from the Championship drop to League one levels, they also lost the buffer that their former Premier League status gave, talk about poor timing! 

Even a solid FA Cup run couldn’t save their broadcasting income.

Commercial revenue surprisingly remained robust, even increasing slightly from £3.3m to £3.4m (3%) despite the loss of their Championship status. Their immediate return means that they are unlikely to see any drop in commercial revenue and now have a platform to build from.

Other revenue remained stable at £0.7m.

Looking ahead, Wigan can expect to see a rise in revenue which should at least double to around £7m due to promotion back to the Championship and could well approach £9-10m. Matchday revenue should return to around £3m while commercial revenue has potential to grow. 

Revenue will still be substantially below their 2017 revenue due to no more parachute payments as mentioned above.

Costs Analysis

Wigan Costs 2018

Wigan saw their costs thankfully decrease last year, falling from £33.9m to £28.9m (15%). This was still a much lower fall than the fall in revenue, hurting profitability hugely. Crazily, revenue is less than 3 times the size of their costs, an unsustainable position to be in for any business for any prolonged period of time.

Amortisation was almost halved in the year, decreasing from £4.4m to £2.4m (45%) as investment in the playing squad fell significantly following relegation which was a necessity.

Interestingly, Wigan disclosed their agent fees which fell from £0.9m to £0.5m (44%), a figure which still seems high considering Wigan spent only £0.6m in transfer fees and received £1.0m.

A huge part of Wigan’s costs and hence loss was due to an accounting impairment on the goodwill in the club that was created when they were brought. Wigan being relegated obviously saw their value plummet and hence the goodwill was devalued due to this (technical accounting sits behind this explanation). The good thing however is that due to the nature of this cost (being just an accounting costs and not a real one), it will not be taken into account in any Financial Fair Play investigation.

Wigan Wages 2018

Wigan saw wages fall from £18.1m to £13.6m (25%) as relegation wage drops came into effect and some high-earners and fringe players left as Wigan attempted to create some sort of wage control to brace for their season in League One.

The wage drop was equivalent to a saving of £87k per week, a sizeable amount for a club the size of Wigan.

Wigan also had interest on new loans of £1.0m in the year, having previously had loans that were interest-free.

Wigan also paid no tax due to their loss in the year.

Looking ahead, Wigan can expect a fall in costs due to the unlikelihood of another sizeable impairment of goodwill. Wages are likely to increase slightly however not substantially as Wigan look to be more prudent following promotion.

Transfers Analysis

Wigan Net Transfer Spend 2018

It was a quiet transfer season for Wigan, with two signings and two departures for low transfer fees.

In came Walker (£0.3m) and Vaughan (£0.3m) for a combined £0.6m.

Out went Bogle (£0.7m) and Woolery (£0.3m) for a combined £1.0m.

This led to a small net income of £0.4m, the 6thconsecutive year of having net transfer income as the club are forced to budget and partly rely on transfer income to stay afloat.

The new signings were important in securing the league title and the departures were not particularly missed despite their quality.

Wigan also recorded a profit on player sales of £1.0m, which is almost all the fees received in the year despite Bogle being purchased the year before for £0.8m. It is likely that the fees on transfermarkt.com are slightly wrong.

In cash terms, Wigan spent cash of £2.8m and received a mini windfall of £5.9m, a net cash income of £3.1m as they received a large amount from previous transfers (most likely Wildschut) which helped the club following the loss this year.

Wigan are also owed a further £0.5m (all due this year) and owe £0.3m (all due this year), meaning they are net due £0.2m which isn’t much and shouldn’t help or hinder any future transfer plans.

There are potential contingent transfer fees payable of £3.6m should certain transfer clauses be met, although it is unlikely a large part of this is ever paid.

Debt Analysis

Wigan Net Debt 2018

Wigan needed all the cash they could get their hands-on meaning cash reserves halved from an already low £1.0m to £0.5m (50%). Wigan used cash received from transfers (£3.1m) and new loans (£2.3m) to subsidise their costly relegation. 

Relegation also threatened investment in club facilities, as investment fell to £0.3m from £0.6m (50%) as club improvements became low priority in the face of poor finances.

Debt increased due to the new loans mentioned above, increasing from £12.3m to £14.8m (20%). Wigan received new bank loans of £1.7m and also new owner loans of £0.9m, while a small amount was repaid to Whelan before the sale of the club. 

Following a sale of Wigan to International Entertainment Corporation (IEC) by Whelan, Whelan is to be repaid all of his loans by IEC which are approximately £11m.

It remains to be seen whether IEC will include this £11m or so as an amount owed to them by Wigan or if they are just going to pay it off as part of the acquisition consideration.

Wigan hence saw net debt increase from £11.3m to £14.3m (27%). Wigan seem financially secure following their sale by Whelan who could no longer cope with the pressures, both financially and sporting.

It now remains to be seen what the level of ambition is of IEC and their plans for Wigan who are in need of investment in their playing squad should they harbour ambitions of remaining a Championship club, let alone returning to the Premier League.

Wigan’s return to the Championship should enable their finances to begin improving although we expect them to remain loss-making for the time being until a return to the Premier League is secured, costs are cut significantly, or a big player is sold.

Lastly, from an FFP standpoint, Wigan should be okay due to the nature of some of their costs which is likely to be excluded when examining whether any rules have been broken.

Thanks for reading – Share with a Wigan fan!

Please follow and like us:
error

Brighton & Hove Albion’s 2018 Finances – Seagulls Soaring

Brighton & Hove Albion's Finances 2018

Brighton enjoyed their first-ever season in the Premier League. A 15thplaced finish exceeded many people’s expectations and a solid FA Cup run meant it was an unforgettable season for Brighton fans.

Brighton’s newfound Premier League status yielded huge boosts to their finances as the club recorded their first profit in years at record levels of £11.3m after recording a loss of £38.9m last year, showcasing the riches available in the Premier League.

Let’s delve into the numbers.

Brighton Profit:Loss 2018

Revenue Analysis

Brighton 2018 Revenue

Brighton saw their revenue soar to record heights, rising from £29.2m to £139.4m (377%) as the riches of the Premier League flowed into the club.

Matchday revenue rose from £14.8m to £18.5m (25%) as attendances grew on the back of promotion from 27,966 to 30,403 (9%) and ticket prices also rose, boosting matchday takings considerably. A run to the FA Cup Quarter Finals also boosted revenue by providing two extra home games.

Broadcasting revenue increased by over £100m, rising from £7.7m to an eye-watering £110.3m (1,332%). The Premier League really showed the reason for its tag as the richest league in the world by this astronomical rise in revenue for Brighton.

Brighton were shown on TV for 13 Premier League games and achieved a solid 15thplaced position, while they also reached the FA Cup Quarter Finals which further boosted their broadcasting revenue.

The new Premier League status of Brighton yielded new opportunities for commercial growth which they took full advantage of. Commercial revenue increased from £5.1m to £8.8m (73%), a figure that should only grow as long as Brighton stay in the Premier League.

Other revenue increased from £1.6m to £1.8m (13%).

Looking ahead Brighton should see another rise in revenue this season. Matchday revenue should increase slightly due to their run to the FA Cup Semi-Final and increasing attendances. Broadcasting revenue should increase due to their FA Cup exploits, however should they finish 16thor lower, revenue may actually fall. Brighton’s commercial revenue should increase to £10m+ otherwise it would have been a disappointing commercial campaign. 

A target revenue of £145m sounds reasonable, with the hope of pushing past the £150m barrier a possibility.

Costs Analysis

Brighton Costs 2018

Brighton saw their costs more than double, soaring from £59.0m to £130.0m (120%). This rise in costs still paled in comparison to the rise in revenue, meaning profitability was strengthened significantly. 

Player investment on promotion was apparent due to amortisation more than tripling, increasing from £6.3m to £19.3m (206%). Brighton made sure they were Premier League ready by recording their largest ever transfer spend.

Costs also rose due to investment in the women’s squad (part of the above amortisation) and investment in club facilities (which increased depreciation significantly).

Brighton also saw facilities damaged or that were no longer fit for purpose, which led to an impairment of £1.9m on certain equipment and facilities.

Brighton also had interest charges of £785k in the year due to interest on transfer fees which were not yet paid after negotiating instalments on their recent transfers.

A tax charge of only £0.8m was paid in the year, an effective tax rate of 6.6%. This is mainly due to Brighton being able to offset this year’s profit with previous losses the club recorded to reduce their tax liability.

Brighton Wages 2018

Wages nearly doubled, increasing from £40.4m to £77.6m (92%) as new Premier League ready players attracted Premier League level wages while current players were rewarded with new, lucrative contracts and bonuses.

The increase in wages cost Brighton an eye-watering extra £715k a week, a huge sum for a club the size of Brighton, although not unusual when clubs are promoted to the Premier League for the first time.

Directors saw a modest rise in salary despite survival, as remuneration rose from £1,673k to £1,855k (11%). Their CEO, Phil Barber, has attracted interest from other Premier League clubs so Brighton may be forced to increase this substantially this year to hold onto their talented CEO.

Looking ahead, Brighton’s costs are only going to increase as long as the club remain in the Premier League. New players will attract higher wages year by year while higher transfer fees will increase amortisation as well. 

Transfers Analysis

Brighton Net Transfer Spend 2018

Brighton had a busy transfer window of incoming players, with 9 players joining. Surprisingly, Brighton did not sell any players for transfer fees in the season (although Murphy and Goldson left in June before the end of Brighton’s financial year, affecting finances slightly).

In came Locadia (£15.3m), Izquierdo (£13.5m), Propper (£11.7m), Ryan (£5.4m), Suttner (£4.1m), Gross (£2.7m), Schelotto (£2.7m), Norman (£1.3m) and Ahannach (£0.5m) for a combined £57.2m.

With no outgoings, Brighton recorded a record-breaking net transfer spend of £57.2m, their third successive net transfer spend.

All the signings contributed to their Premier League survival with Gross proving to be one of the signings of the season while Propper, Ryan, Izquierdo and Locadia all impressed.

Brighton recorded a profit on player sales of £3.4m as the 2018/19 summer transfer sales of Goldson and Murphy were completed in June, before the end of Brighton’s financial year so was included in their finances despite not relating to the 17/18 season.

In cash terms, Brighton saw a huge outflow in cash as they spent £41.7m in cash and only received a measly £0.7m.

Brighton also owe a further £19.0m (of which £9.9m is due this year) while they are only owed £2.9m (of which £1.5m is due this year), a net position of owing £16.1m (of which £8.4m is due this year).

Although not ridiculously large, this may still affect future transfer plans.

Brighton could also potentially owe a further £6.3m if certain transfer clauses are met, although they could potentially be due £3.3m themselves if certain transfer clauses are met in their favour.

Debt Analysis

Brighton Net Debt 2018

Brighton’s first-ever Premier League season saw a huge increase in their cash reserves, taking them from an overdraft of £16.2m to having actual cash of £9.0m, a £25.2m swing.

This improvement in cash was largely due to the astronomical rise in revenue and the profit this brought. This cash was largely committed to transfers (£40m) and improving the club facilities (£10m). This did need a bit of funding, and their owners obliged by providing a loan of £32m.

The above mentioned loan from their owners of £32m increased their debt from £190.7m to £222.8m (17%) as A G Bloom provided further interest-free loans to Brighton to help their successful survival battle. This huge £223m of investment to date shows the huge sums it can take to bring a club to the Premier League.

However, this is only the start and further investment is likely to be needed to keep Brighton in the Premier League.

Net debt rose slightly, increasing from £206.9m to £213.8m (3%) as the rise in cash was bested by the rise in owner debt. Brighton are well on their way to becoming a sustainably run club, although their Premier League status is paramount to this goal.

There is still some way to go and further investment will be required before they are self-sufficient which is likely to take another 3/4 years of Premier League football. The current investment and funding is being spent wisely, improving both the playing squad’s quality and the quality of their facilities and as long as this continues, the club are in safe hands.

Thanks for reading – Share with a Brighton fan!

Please follow and like us:
error

Watford FC’s 2018 Finances – Mixed (Marco) Bag

Watford FC's Finances 2018

Watford completed their third successive season in the Premier League and will enter their fourth in the Premier League after a successful campaign ended in Premier League survival after a 14thplaced finish.

Following a great start to the season under Marco Silva, a hostile approach from Everton for their manager’s services derailed their season severely and ultimately led to his sacking and replacement in Javi Garcia who has since steadied the ship and led Watford to an impressive 2019 to date.

Off the pitch, rising costs and the lack of player sales saw a profit of £8.1m in 2017 turn to a huge loss of £30.7m in 2018. The sale of Richarlison at the end of last season should reverse this figure.

Let’s delve into the numbers.

Watford Profit:Loss 2018

Revenue Analysis

Watford 2018 Revenue

Watford saw a slight rise in revenue in 2018, as revenue increased from £123.9m to £127.4m (3%).

Matchday revenue rose from £7.6m to £8.0m (5%) as fan attendance rose at the club, and although failing to progress far in the cups, were afforded two home ties in their short campaigns in both which boosted revenue.

Broadcasting revenue increased from £105.4m to £108.8m (3%) after finishing 3 places higher than the higher season. A poor cup campaign stopped revenue from rising even further.

Commercial revenue rose well, increasing from £9.3m to £10.6m (14%) after Watford managed to renegotiate their main sponsorship deal with FxPro on more lucrative terms.

Other revenue halved from £1.6m to £0.8m (50%).

Looking ahead, Watford should see a decent rise in revenue next year with a top half finish looking likely and further progression in the cups then in previous years. Matchday revenue will increase due to more home games, while commercial revenue should increase if their commercial team has managed to capitalise on their growing stature and popularity. 

Costs Analysis

Watford Costs 2018

Watford saw a bigger rise in costs then revenue, hurting profitability. Costs rose from £138.8m to £157.7m (14%).

Amortisation was the main driver of this rise, increasing from £28.6m to £41.5m (45%) as Watford invested significantly in their playing squad as they looked to consolidate their Premier League status.

The effects of Brexit were felt slightly as Watford recorded an FX loss of £331k.

Watford saw a large increase in their interest costs, rising from £3.5m to £5.2m (49%) on the back of an increase in interest-bearing loans to their owners.

Watford Wages 2018

Watford also saw a sizeable increase in wage costs, rising from £74.8m to £85.9m (15%) after a sizeable investment on new, higher-earning players as well as rewarding existing players with new contracts.

The wage rise worked out at a noticeable extra £213k a week, which although sizeable for Watford at the time, is not unusual for a Premier League club.

Watford’s director saw their pay increase from £571k to £631k (11%) after a good season.

Looking ahead, Watford would expect costs to rise further as wages continue to rise with the times while further investment will see amortisation rise. Revenue should increase to a greater extent next year, so Watford will be hoping profitability improves next season.

Transfers Analysis

Watford Net Transfer Spend 2018

Watford were fairly busy spending on transfers last season, bringing in 10 players while 5 left.

In came Gray (£18.4m), Richarlison (£11.2m), Cleverley (£8.4m), Hughes (£8.2m), Chalobah (£5.7m), Lukebakio (£4.5m), Dahlberg (£3.5m), Zeegelaar (£2.7m), Deulofeu (Loan – £0.9m) and Carrillo (Loan – £0.9m) for a combined £64.3m.

Out went Berghuis (£5.9m), Kums (£5.9m), Agbo (£2.3m), Juanfran (£0.9m) and Zarate (Loan – £0.2m) for a combined £15.1m.

This led to a net spend of £49.2m, a 360% increase on the prior year and the fourth consecutive net spend Watford have recorded.

The majority of the signings were a success. Richarlison was a home run, while the home-grown signings of Cleverley, Hughes and Chalobah were shrewd additions. The only blots were potentially Lukebakio and Dahlberg while Gray has been disappointing when considering the fee but a useful addition nonetheless.

None of the departures were particularly missed.

The player sales did not help Watford in recording a profit as they only led to a profit on player sales of £2.9m. This will be completely different next year after the sale of Richarlison who Watford should record a profit in excess of £25m on.

In cash terms, Watford spent a relatively high £51.0m on transfers and received £19.3m (receiving some fees due from earlier seasons). This led to a net cash spend of £31.7m, a lot lower than their actual net spend of £49.2m.

Watford are also owed a further £13.3m in transfer fees, of which the majority (£12.1m) is owed this year.

In contrast, Watford owe an eye-watering £90.4m in transfer fees, of which a staggering £64.0m is due this year.

This means Watford owe a net £77.1m, a huge amount for a club the size of Watford that may complicate future transfer plans and lead to the sale of key players (such as Doucoure).

Watford also could potentially have to pay a further £21.2m due to contingent transfer fees should certain clauses be met, although this is unlikely to all be payable, if any.

Debt Analysis

Watford Net Debt 2018

Watford saw a slight fall in cash levels, falling from £10.0m to £8.2m (18%), its lowest levels since promotion after increases in player investment and costs, plus a £5.4m in their stadium and training facilities. This was in part funded by new loans of around £30m.

Watford saw their debt levels balloon after an increase in investment and ambition, rising from £48.9m to £83.4m (71%) as new loans of £36.7m were taken out with their owners, while £7m was repaid (net result of £29.7m).

Of this debt, £80.5m is from their owners with the remainder being external debt. The £80.5m attracts varying rates of inters from 4.5% to 6% depending on when it was received. Other loans in contrast attract rates of between 1.5% and 3%.

Watford were probably due a bit more investment from their owners and it was needed after a close shave the previous year after finishing 17thin the Premier League. Such investment shows the owner’s intention to build the club as a top-half Premier League club.

Watford hence saw net debt rise from £38.9m to £75.2m (93%) after the large investment.

Watford are on financial solid foundation which will remain that way as long as the club remain a Premier League club. After a solid season so far in 2019, this looks likely to be the case for some time. A couple more years of shrewd signings and good decisions should go a long way to making Watford a self-sustaining club.

Thanks for reading – Share with a Hornet!

Please follow and like us:
error