Burnley 2019 Finances Predicted – Dyche’s Europa Nightmare

Burnley 2019 Financial Predictions

Burnley had a spectacular 2018, finishing 7thand securing a preliminary spot in the Europa League for 2019. This seemed to promise newfound riches in what was their first season in Europe for 51 years.

However, qualifying was harder than expected with a half fit squad barely back from their holidays and with the headache of balancing their early Premier League fixtures, Burnley found themselves out in the Play-off round against Greek club Olympiacos.

This was disappointing not only due to the failure to make the groupstage, but it was a sign of things to come as Burnley struggled to match their previous season performances following a lack of significant investment, nearly seeing the side relegated before they steered clear to a 15thplaced finish.

This article analyses the effects of Burnley’s (short) European adventure and their disappointing domestic campaign on their finances.

Revenue Prediction

Burnley 2019 Revenue Prediction

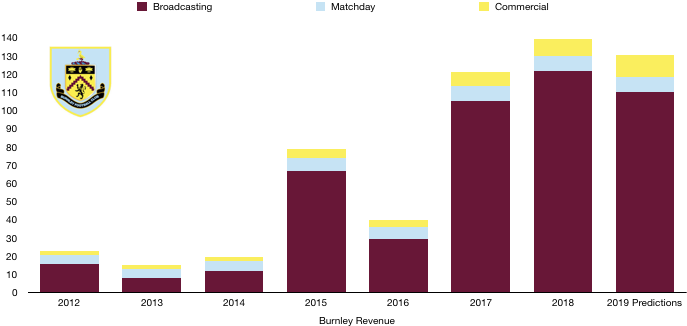
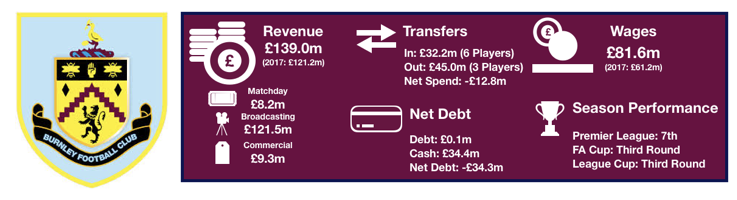
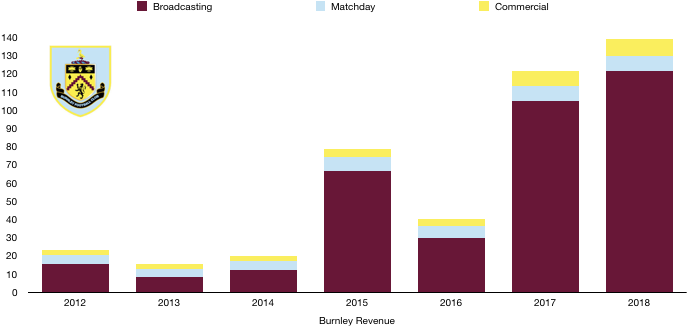
Burnley saw their revenue rise to record levels of £139m in 2018 following their remarkable 2018 achievements given their budget. Things were not so rosy in 2019…

Matchday Revenue

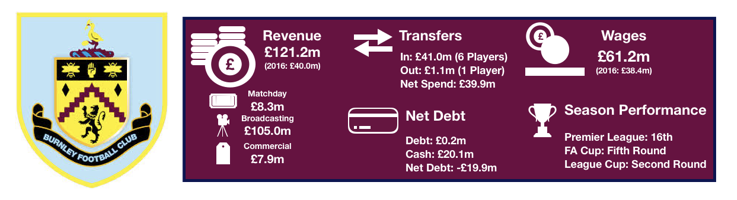
Burnley saw a nice boost to matchday revenue from £7m to £8m following promotion in 2017, at which level it has remained since.

Average attendance at Premier League games fell slightly from 20,688 to 20,534 (1%). Despite this, Burnley’s adventures into Europe yielded an additional 3 home games and although it ended quickly, Burnley should see matchday revenue rise slightly but remain at the £8m level (when rounded).

Broadcasting Revenue

Burnley saw broadcasting revenue reach record levels of £122m in 2018 following their 7thplaced Premier League finish, which made up a huge 88% of their total revenue in 2018.

The majority of broadcasting revenue is Premier League revenue for Burnley, accounting for £120m of the £122m in 2018. Following a drop of 8 places to 15thin 2019, Premier League revenue dropped £13m in 2019 to £107m. This is despite Burnley seeing an extra televised game (11) in 2019 following their relegation battle.

Burnley didn’t fare much better in the domestic cups. Burnley went one round further in the FA Cup to the 4thRound, netting approximately £136k extra from this. League Cup performances were just as bad as 2018, exiting in the Third Round.

Now, the Europa League was meant to be a nice boost to Burnley’s finances in 2019, with a place in the group stage potentially worth £7-10m based on performances.

However, an exit in the Play-Off round meant none of this was realised and Burnley can only expect to receive around £1m for their troubles, a disappointing figure.

Therefore, Burnley should see a sharp drop of around £12m in broadcasting revenue to £110m in 2019, adversely affecting their bottom line.

Commercial Revenue

Burnley have seen commercial revenue more than double since promotion, rising from £4m in 2016 to £9m in 2018.

This trend is likely to continue on the back of the successes of 2018, with a new, slightly more lucrative deal agreed with Laba360 (£3m a year), who replace Dafabet (£2.5m a year) as their main sponsor.

This, plus many smaller partnerships should see a boost to around £11/12m in commercial revenue, a £3m rise.

Total Revenue

Overall, it wasn’t the season Burnley were hoping for and as such, it will have a negative impact on their revenue, primarily due to the sharp drop in the Premier League table.

Combining the above adjustments, revenue is likely to fall by around £9m to £130m, showing that clubs cannot rest on their laurels as the pace of the Premier League club is brutal. Burnley were never expected to repeat 2018’s heroics and a drop off was expected, however the failure to reach the Europa League group stage saw revenue fall by a greater amount than was expected.

Any improvement on last season’s 15thplaced finish in 2019/20 will see a rise in revenue.

Cost Predictions

Burnley 2019 Costs Prediction

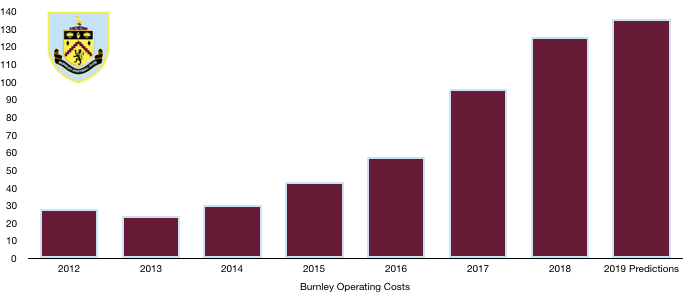
Burnley somehow secured a 7thplaced finish with costs of only £126m in 2018, a ridiculously low figure. By comparison, Everton and Leicester had costs of £287m and £193m respectively, showcasing the huge achievement it was.

Despite revenue being likely to drop in 2019, costs continue to increase as the cost to compete and survive in the Premier League continue to grow…

Amortisation

Burnley had amortisation of £28m in 2018, a relatively low figure. Player investment was greater than in recent years despite being nothing major in comparison to their rivals and will see amortisation rise.

Based on the transfer fees and contract lengths of the new signings and those sold, we expect amortisation to rise by around £8m to £36m for Burnley.

Wages and Other Costs

Other expenses such as stadium maintenance, lease costs etc. amounted to £16m in 2018. These costs rose by £2m from £14m in 2017 and we expect a similar rise this year to £18m.

Burnley 2019 Wages Prediction

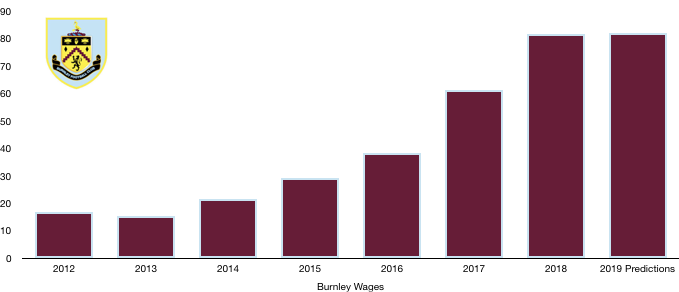
Wages are the most difficult area of finances to predict due to the opaque nature and privacy of these amounts. Burnley’s wage bill was £82m in 2018.

Burnley signed Gibson, Vydra and Hart while Vokes and a host of fringe players left (Long, Arfield, Marney). New contracts were provided to McNeil and Hendrick which will see wages rise slightly.

Loans of Wells and Walters are likely to however reduce the wage bill. Based on the data available, wages are likely to remain at £82m and perhaps even fall based on the release of fringe players on decent wages and the players signed not commanding huge wages.

Burnley are also likely to see a significant fall in bonuses which may actually see wages fall to around £80m, however due to the opaqueness of this, our best bet is wages flatline. 

Total Costs

Based on these additional costs, we expect total costs to increase by around £10m from £126m to £136m, largely due to amortisation rising.

This means that before taking into account transfers, unlike 2018, Burnley will be losing money, approximately £6m, should this continue into the future (which we don’t think it will) this could quickly cause financial issues.

However, Burnley are a well-run club that brilliantly live within their means to great success and we expect Sean Dyche and Co to continue thriving in the difficult Premier League arena.

Transfers Analysis

Burnley 2019 Transfers

Burnley spent only £30m to build on their 7thplaced finish in 2018, purchasing Gibson (£15m), Vydra (£11m) and Hart (£4m) while the only monetary departure as Vokes for £7m.

This led to a net transfer spend of £23m, a £36m swing on 2018’s net income of £13m (another showcase of how remarkable their 2018 campaign was).

The signings were uninspiring to say the least. Gibson failed to readapt to the Premier League and struggled to get into the side. Vydra provided relatively little goals and Hart fell out of favour following a series of errors.

This meant that Dyche once again relied predominately on the same players as last year which proved difficult with everyone else improving and some of their dependable players suffering dips in form.

In 2018, Burnley realised a profit on player sales of £30m following the sales of Keane and Gray, which significantly boosted profits. 

With only the sale of Vokes in 2019, this will fall significantly. Vokes was brought in 2012 and no longer attracts amortisation and therefore the full £7m will be recognised as profits; this is still a £23m drop in profits compared to last year.

In terms of transfer fees owed, Burnley were still owed around £28m (predominately from Everton and Watford) of which £7m was due in 2019 and later.

In comparison Burnley owe £23m in transfers in 2018, of which £9m was due 2019 and later. There is not much between these figures and therefore this should have no impact on future transfer plans.

Another season of little sales will see a similar level of profit on sales as is expected in 2019, with the only summer departure being Heaton for £8m. Similarly, to Vokes, this will all be profit.

Profit/Loss Prediction

Burnley 2019 Profit Prediction

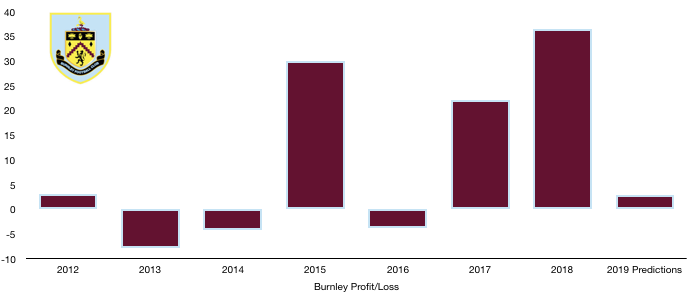
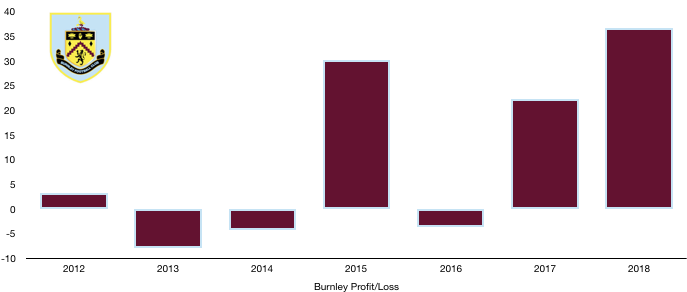
Burnley made a profit before tax of £45m in 2018 (£37m after tax) and this will see a significant drop in 2019.

With revenue falling by around £9m and costs likely to rise by around £10m, profits before transfers are taking into account will fall to around £26m. 

Then taking into account the lack of sales in 2019 and hence a much lower profit in player sales, profit are likely to fall by a further £23m to around £3m, a £42m drop. 

These drops in profitability may be a common theme of 2019 for most mid-table Premier League clubs with the costs of competing in the top flight rising considerably. Clubs look like only recording profits currently based on player sales rather than underlying financial stability.

Burnley can however still be positive as they are still very financially stable with many of their rivals likely to record losses on the back of similar seasons.

Burnley are run very sustainably and are in safe hands and look primed to have a more successful season this time out, although the priority is still survival.

I hope you enjoyed this article! Share with a Burnley fan and look out for when the actual finances are released to see how we fared!

Please follow and like us:
error

Burnley FC’s 2018 Finances – Moor Profits

Burnley FC's 2018 Finances

Burnley secured a third consecutive year in the Premier League in style by beating all expectations and achieving a 7th placed finish. This astonishing achievement meant Burnley qualified for the Europa League, with 2018/19 being their first season in Europe for over 50 years.

Their success in the Premier League came at the detriment of their domestic cup campaigns with poor performances in both.

A great season was capped off with recording breaking profits, with profits rising from £22.2m to £36.6m (65%).

Let’s delve into the numbers.

Burnley FC Profit:Loss 2018

Revenue Analysis

Burnley FC 2018 Revenue

Burnley saw revenue reach record levels, rising from £121.2m to £139.0m (16%) after a great season.

Matchday revenue remained stable at £8.2m. Average attendance increased from 20,558 to 20,688 (0.6%), however Burnley are restricted by their stadium which only seats 21,401. This makes expanding Turf Moor a priority should Burnley wish to increase long term revenue.

Broadcasting revenue rose from £105.0m to £121.5m (16%) after Burnley finished 9 places higher than in 2017. The 7th placed finish was the main reason for their rise in revenue, meaning that with Burnley likely to finish much lower in the league this season, Broadcasting revenue will be hit.

Commercial revenue rose from £8.0m to £9.3m (16%) as Burnley saw their popularity grow after a great season and further consolidation of their Premier League status. This should increase going forward due to their European campaign and ongoing Premier League status.

Looking ahead, Burnley will most likely see a similar level of revenue despite a poor campaign.

The Europa League money should offset some (or all) of the lost Premier League revenue however due to Burnley failing to make the group stage, their Europa League windfall may be less than hoped and broadcasting revenue may fall.

Matchday revenue will rise slightly after more home games this season, while commercial revenue will increase with another season in the Premier League.

Costs Analysis

Burnley FC Costs 2018

Burnley saw their costs continue to rise as they grow as a Premier League club. Operating expenses rose from £95.8m to £125.8m (31%). This rise of 31% was far greater than the 16% rise in revenue, hurting profitability.

Amortisation costs increased from £22.4m to £27.4m (24%) signifying player investment, although they had a negative net transfer spend. This was largely due to the sale of Keane who was brought cheaply so carried little amortisation charge, and since a large portion of this was reinvested, amortisation rose.

There are minimal interest costs for Burnley due to the absence of debt in the club (see debt analysis).

Burnley paid tax of £8.5m, an effective tax rate of 19%. This is equivalent to the UK Corporate tax rate of 19%.

Burnley FC Wages 2018

Wages once again rose but remained well below £100m, increasing from £61.2m to £81.6m (33%) after the addition of higher-earners and also the reward of new, lucrative contracts for their key players.

This wage bill is still closer to the bottom of the wage charts in the Premier League, but is slowly becoming more competitive, making their achievements in 2018 even more astonishing.

Burnley did not disclose any director renumeration in 2018.

Looking ahead, costs will continue to rise with the times. Burnley signed new players which will increase both amortisation and wages, although wages may fall if Burnley are relegated (due to relegation wage drops), although this looks extremely unlikely after a strong run of form.

Transfers Analysis

Burnley FC Net Transfer Spend 2018

Burnley had a busy transfer season in 2018, signing 6 players and selling 3.

In came Wood (£14.8m), Cork (£8.2m), Wells (£4.9m), Walters (£2.1m), Lennon (£1.5m) and Bardsley (£0.8m) for a combined £32.2m.

Leaving Turf Moor were Keane (£25.7m), Gray (£18.4m) and Darikwa (£1.0m) for a combined £45.0m.

Therefore, Burnley achieved a 7th placed Premier League finish despite a negative net spend of £12.8m.

Wood, Cork and Lennon proved great signings at relatively low fees and fitted well with the playing style of the club, slotting in seamlessly. Wells, Walters and Bardsley also proved good back up options.

Burnley recorded a profit on player sales of £30.7m due to the sales of Keane and Gray, this makes up the majority of the profit Burnley made, although they would still have been profitable without these sales, something most clubs cannot put their hands up too.

However, there was a lack of player sales however this season, meaning Burnley will see a steep fall in their profits this year.

In cash terms, Burnley spent £41.4m and recouped cash of £14.6m, a sizeable net outlay of £26.8m despite recording a net transfer income of £12.8m after negotiating to be paid in instalments.

Due to this, Burnley are owed £27.9m in transfer fees, although they do owe £22.5m themselves (£13.3m due this year), a net debtor position of £5.4m, a good position to be in.

This should also help with future transfer plans as they do not need to fund any previous transfers.

Burnley could potentially have to pay a further £13.0m in transfer related fees if certain clauses are met, although it is unlikely this will all become payable.

Debt Analysis

Burnley FC Net Debt 2018

There is not much to say about Burnley from a debt perspective.

Cash levels grew even more robust, rising from £20.1m to £34.4m (71%). This was largely due to the profits recorded from rising revenues which helped fund their transfer outlay (although they are due to receive more transfer fees later) and also allowed Burnley to spend a sizeable £6.1m on club infrastructure, a much-needed investment as they continue to grow as a Premier League club.

Debt levels halved! From £0.2m to £0.1m …

Hence net cash increased from £19.9m to £34.3m (72%).

Burnley are, and have been an essentially debt-free club for years. Burnley are a model club for how to sustainably run a football club, being patient to reach their goals and not ever overstretching themselves.

Sometimes this can be criticised as too prudent, an argument that has some merits. Burnley should be careful not to be too prudent and risk an unneeded relegation (although I would expect them to bounce right back) which makes this season likely to be the wake-up call they need.

With their robust finances, now seems a great time to begin expanding their stadium and investing a bit heavier (but smart and sensibly) in the squad.

Thanks for reading! Share with your network.

Please follow and like us:
error

Premier League 2018 Review – Wages

Premier League 2018 Wages Review

As Premier League clubs grow richer, so do the players as we saw in our revenue analysis, revenue has increased dramatically and so have wages, rising 18.5% to surpass the £2.5bn barrier.

In this new Premier League world, we have wages of £150k a week as commonplace throughout the league, not just the top 6. Wages rose by over £7.5m per week and this includes the growing wage of directors and key management as their competence off the field grows in importance.

This article analyses the wages of players and directors among Premier League clubs competing in the 2016/17 season.

Who’s Up, Who’s Down?

Premier League 2017 Wage Growth

Wages increased on average by 28.6% as the majority of clubs saw sharp increases due to increased player investment.

The promoted clubs were key contributors here with Burnley (59.4%), Middlesbrough (100.3%) and Hull (104.3%) experiencing the highest growth rates as they looked to align their wages with their newly earned Premier League riches. Interestingly, only Burnley survived despite being considerably more cautious with their wages than the other two.

Chelsea (-1.2%) and Liverpool (-0.6%) were surprisingly the only clubs to experience a fall in wages, albeit very small drops. Chelsea’s sales of high earners Oscar, Cuardrado (Loan), Ivanovic and Mikel were the main reasons for this in a season of few high-profile purchases. Liverpool similarly saw the exit of Benteke, Skrtel, Balotelli and Sakho who were all on high wages as Jurgen Klopp began his rebuild.

Tottenham saw wages grow by 26.9% as they looked to reward their players performances with new, improved contracts such as Kane, Alli and Eriksen. The purchases of Sissoko, Janssen and Wanyama supported this growth with the only high-earner to depart being Chadli.

Manchester City financial growth saw no signs of slowing down as wages grew by 33.5% as the Guardiola era began with a summer transfer spree featuring minimal departures as surplus players entered the final year or two of their high paid contracts, we expect wage growth to fall as these players depart at the end of their contracts.

Rivals Manchester United experienced a smaller rise of only 13.5% despite the high-profile purchases of Pogba and Ibrahimović due to a number of departures and the relative size of their wage bill already.

Leicester rewarded their Premier League winning squad with substantial pay rises leading to wage growth of 40% as the likes of Vardy, Mahrez and Schmeichel signed new deals which was added to by new higher profile players.

On the low side alongside Chelsea and Liverpool were Sunderland (0.6%) and Stoke (3.2%), possibly signalling they were worried about their soon to be relegations and were preparing for as much.

Premier League 2017 Wage Growth per week

In absolute terms, the average wage rise was £375k per week, or £19.5m a year. Leading the way however was Manchester City’s astronomical rise of £1.3m a week in wages after their transfer spree to introduce Guardiola to the Premier League.

Crystal Palace saw wages rise £600k a week after the introduction of Sam Allardyce who used the winter transfer window to significantly strengthen the squad with a sizeable investment, a tactic that ultimately worked as they secured survival.

Middlesbrough also experienced a £600k a week increase but were unfortunately much less successful in doing so after suffering relegation and the unenviable wage reduction strategy required. Wages are likely to fall automatically as relegation wage clauses come into effect.

Tottenham significant contract renewals contributed to wages rising by £517k a week as Harry Kane and Co became richer after another top 4 finish for the club.

Manchester United saw wages rise by £600k a week despite a relatively small % increase due to the enormous size of their wage bill to begin with.

As mentioned, on the other end of the scale is Chelsea and Liverpool who saw minimal wage drops per week of £50k and £15k, remaining relatively stable in terms of wages after offloading deadwood.

Arsenal also remained relatively stable with wages growing by £77k a week, a minimal 2% increase for the club.

Wage to Revenue Ratio

Premier League 2017 Wage Turnover ratio

A key performance indicator for all clubs, the wage: revenue ratio is key to a club in measuring financially stability and prudence. A high ratio suggests overspending, making profitability almost impossible whilst a ratio too low suggest over cautiousness and a failure maximise the use of resources. The average is 57% and most clubs will be aiming for a ratio of 50-55%.

The ratio shows a clear trade-off between risk and reward with clubs having to balance the need to grow and meet their targets and their financial future. Clubs near the bottom of the Premier League are likely to have higher ratios due to their lower revenues, however these clubs still spend an awful lot on wages due to the riches of staying in the Premier League.

Those higher up the table pay higher wages but see relatively higher revenue – which is what those spending large near the bottom are aspiring to.

Crystal Palace have the highest rate at 78.5% after their huge spending in the winter transfer window to preserve their Premier League status, a gamble that paid off but also potentially jeopardised their future, however such a gamble has enriched those at the club including senior management (more on this later).

Swansea’s was nearly as high at 77.3% due to low revenue and relatively high wages, a situation we hope they have remedied in 2018 after relegation which will cause this key ratio to increase.

Tottenham much discussed wage policy sees them achieve the lowest ratio at 41.4% as Daniel Levy continues to run a tight ship, something he is proud of considering their recent domestic performances, an increase in revenue will however help them increase their wages more in line with their rivals.

North London rivals Arsenal are 3rdon the list at 47.6%, another club who are notoriously known under Wenger to watch the purse strings, it must be something in the water up in North London!

Manchester United despite have one of the largest wage bills in world football have a wage to revenue ratio of only 45.3% due to the huge revenue they generate, showcasing that potentially player investment and huge wages leads to larger revenue, a model that Manchester City seem to have adopted in their earlier years.

Chelsea at 60.8% have the highest ratio due to providing players with historically high wages whilst also stockpiling young talent meaning they have more player wages on their books.

Liverpool (57%) and Manchester City (55.8%) complete the top 6 who all have lower than 61% ratios which is around the ball park most clubs should be.

Other than Chelsea, Crystal Palace and Swansea, the only other clubs with ratios above 60% are Everton (61.1%), Southampton (61.2%), Stoke (62.5%), Sunderland (66.8%) and Watford (60.3%), all clubs with aspirations of growing despite Sunderland and Stoke’s recent troubles.

Of the rest, Burnley’s low ratio (50.5%) should be commended due to their performances in 2017 and 2018. Outside of those already mentioned Bournemouth (52.4%), Hull (52.4%), Middlesbrough (53.5%) and West Ham (51.8%) all have ratios below 55%.

Rich Directors

Premier League 2017 Director Wages

Directors and key management staff are becoming increasingly vital to the success of football clubs with their business acumen key in driving revenue from off the field sources. The work of many executives has been praised in both the transfer market and in raising the profile of their club. A good executive can propel a financially ruined club into a viable business and footballing success.

This is apparent in the fact that directors’ salaries rose 19% to £41.5m despite not playing a minute of football, with the average salary being just under £4m, working out an average of £72k a week which is a respectable Premier League footballer wage.

However, note that director salary disclosures in the accounts may not show the full picture with some directors paid in other opaque companies and through other means which are hidden and difficult to locate so the numbers here are likely to be understated to some degree.

The highest director compensation paid was by Manchester United unsurprisingly considering their global profile and stock listing. Manchester United directors were paid £12.5m last year with this including stock options that may be more valuable than recorded currently.

Tottenham are the next closet some way behind with payments of £9m with Daniel Levy paying himself £6m as a golden pat on the back for the recent successes of the club that few would argue with despite his insistence of being more prudent than that on his players.

Arsenal also pay highly with directors being paid £3.4m despite performing poorly as of late.

Liverpool’s directors were paid relatively poorly compared to their above rivals, receiving a meagre £1.6m.

Chelsea and Manchester City had minimal values in their accounts. This may have to do with Chelsea having no CEO for the majority of the year and until the appointment of Guy Laurence. The payments for other key management were likely to not have been disclosed and as such no analysis can be performed. There is a similar story for Burnley as well.

The lowest outside of this appears to be Hull with payments of only £185k made to directors.

Also, below £1m were Leicester (£325k), Stoke (£806k), Swansea (£634k) and Watford (£571k). The most surprising club here is Leicester due to the absence of any significant rise in director payments despite the incredible season they recently had.

Crystal Palace have a notably high compensation package for directors with wages paid to directors of £2.4m, with Steve Parrish paying himself all of that as the club’s only director after the club steered clear of relegation last year, a controversial decision by the Mr. Parrish.

Wages Summary

Premier League 2017 Wages

There was £2.5bn in wages last year, an eye-watering £48.1m a week with Premier League clubs incurring an average wage bill of £125m. The Premier League Top 6 account for a huge 51% of total wages, showing their unparalleled financial power.

There was a change at the top of the wage bill chart as Manchester City’s continuing financial growth saw them shell out £264.1m in Guardiola’s first season, overtaking Manchester United who paid out £263.5m in wages.

Chelsea (£219.7m), Liverpool (£207.5m) and Arsenal (£199.4m) follow at around the £200m mark as they continue to pay players top dollar to maintain their power and clutch of world class players.

The ever-rising Tottenham lag their rivals yet again in this department, paying out ‘only’ £126.9m on wages due to Levy’s tight wage policy, a strategy that may see them struggle to keep competing with their rivals.

Burnley must be commended for their comfortable survival despite operating the lowest wage bill in the Premier League of £61.2m.

Bournemouth (£64.9m) and Hull (£61.3m) were the only other clubs with wages under £70m.

On the other end of the scale, Leicester (£112.6m), Everton (£104.7m), Crystal Palace (£111.8m) and Southampton (£112.4m) were the only clubs outside the top 6 with wages exceeding £100m.

With this all said, wages are likely to continue increasing as the amount of revenue continues to rise in the Premier League and player wage demands continue to rise and the price of relegation becomes costlier. Wages are likely to increase to around £3bn in the coming year.

Thanks for reading, share with a friend!


Please follow and like us:
error

The True Costs of Transfers

Premier League True Summer Transfer Cost

The True Costs of the Premier League 2018 Summer Transfer Window

The Premier League transfer window has officially shut with over £1.2bn spent by Premier League clubs ahead of the new season.

Clubs have to be wary of Financial Fair Play when purchasing players to avoid penalties and bans (for more on this click here) and also need to ensure they are running sustainably for their owners etc.

This brings us to this article, which will explain the true costs of transfers from the 2018 summer transfer window explained briefly below:

When clubs sign a player, from an accounting perspective this is not all charged in the year of the transfer as the payments are matched to how the player will be used. So, a player signing for £50m on a 5-year contract is deemed to cost the club £10m a year, known as the amortisation cost. This is the true costs of the transfer per season for the club.

Another key element is player sales. In this regard the profit the club gain is not simply the transfer fee received minus the transfer fee paid, it is the transfer fee received less the remaining value of the player sold. So, for a £50m player on a 5-year contract, he will be ‘worth’ £50m minus the amortisation charges to date, so after two years of charges, the player will be ‘worth’ £30m. Hence, should a player be sold 2 years later for £50m, a ‘profit’ of £20m will be recorded, rather than nothing like many people believe.

This article will analyse each Premier League club’s business and compare to their counterparts.

Due to the availability of data, this excludes the costs of loans and player wages. All transfer fees and contract lengths are via Transfmartk.co.uk. In order to simplify the amortisation costs, we have ignored contract renewals which make the calculation more complex without much added insight.

Let’s Not Talk About Spend, Let’s Talk About Net Spend

Premier League Transfer Net Spend

Premier League clubs had an active transfer window despite its shortening, spending over £1.2bn, receiving only £353m in return, leaving the club with an astronomical net spend of £909m.

This was due to higher spending by certain clubs, with Liverpool leading the way by a distant after investing heavily following their Champions League heartache with Naby Keita, Fabinho, Alisson and Shaqiri joining while only Danny Ward left, leaving the merseysiders with a net spend of £151m.

Fulham became the first promoted club to ever break the £100m barrier after a barnstorming transfer window with 7 players arriving for transfer fees and only 1 leaving. This led to the club having a net transfer spend of £101m with Seri the pick of the players signed.

Fellow West Londoners Chelsea had the third biggest net spend at £92m after breaking the world transfer record for a goalkeeper in the £72m paid for Kepa after losing Courtois to Real Madrid and they also signed Jorginho.

Manchester United and Manchester City had quiet windows with both making one big purchase a piece with Fred joining United (along with Dalot and Grant) and Mahrez joining City.

At the other end of the scale were Watford with a net transfer spend of minus £23m after not reinvesting all of their Richarlison windfall. Newcastle also were in the black after recording a net transfer spend of minus £13m as Mike Ashley used transfer cash received to purchase House of Fraser rather than reinvest in the Toon.

Additional Amortisation Costs

Premier League Amortisation Costs

Premier League clubs face additional transfer costs of £275m this year alone after a huge transfer spend of over £1.2bn, with this cost spread of the players signed contracts which average at just over 4-year contracts.

Amortisation costs are, as explained above, based on transfer spend and contract lengths and as such the costs are higher for larger spends and also higher when contract lengths are shorter. A key example is Kepa, a £72m keeper who signed a 7-year contract, costing Chelsea just over £10m a year. While Mahrez, a £61m purchase on a 5-year contract cost Manchester City more at just over £12m a year despite the smaller transfer fee.

Liverpool unsurprisingly lead the way after their impressive transfer window where they spent £164m with Alisson signing a 6-year contract while Keita, Fabinho and Shaqiri signed 5-year deals. Liverpool will have additional costs of £31m after these deals.

Fulham had the second highest net spend after their £105m 7 player splurge with contracts lengths 4 years on average, bringing amortisation costs of £24m over that period.

Leicester despite their relatively small net spend have a large transfer costs due to their £103m spend with the Mahrez deal diluting their net spend after the club reinvested the Mahrez cash and then some, leading to an amortisation cost of £22m.

Chelsea and West Ham also had large amortisation costs above £20m after their productive transfer windows.

Tottenham were at the other end of scale after an inactive transfer window, becoming the first club since the transfer window came into effect in 2003 not to purchase or sell a player.

Crystal Palace were the only other club to have an additional amortisation cost below £5m.

Amortisation Costs Savings

Premier League Amortisation Savings

Premier League clubs saved £41m on amortisation cost after after player sales of £353m with many players sold either brought cheaply or have been long serving players that no longer attract amortisation costs after staying longer than their original contract.

Amortisation costs savings are driven again by the transfer fee paid when the player was brought and their original contract length. So, for instance Daley Blind signed for Manchester United 4 years ago for £15.8m on a 4-year contract, costing Manchester United just under £4m a year for those 4 years. Now that the 4 years are up, Blind costs United nothing from an accounting perspective, so no amortisation costs are saved and hence no savings included in our calculations.

As such many Premier League clubs didn’t recorded any savings as the players sold had already seen their entire transfer fee amortised. This includes players signed as youths such as Danny Ward at Liverpool or long serving players such as Courtois at Chelsea.

In a couple of situations, players were signed and immediately sold. This was the case for Benik Afobe at Wolves and Mikel Merino for Newcastle. In both these cases the amortisation costs were excluded when calculating additional costs and savings.

Bournemouth were the biggest savers, saving just under £8m after the sales of the after mentioned Benik Afobe to Wolves (before Wolves later sold him to Stoke), Lewis Grabban and Max Gradel.

Everton (£7m), Newcastle (£6m) and Watford (£5.5m) were the only other clubs to save in excess of £5m on player sales after the sales of the likes of Klassen, Mitrovic and Richarlison.

Burnley, Cardiff, Crystal Palace and Tottenham sold no players hence the reason for their lack of amortisation costs savings.

Chelsea, Liverpool, Manchester United, Southampton and West Ham also had no amortisation costs savings despite player sales due to the players sold having been at the club for at least their original contract lengths such as Courtois, Danny Ward, Blind, Tadic and Kouyate.

Profit, Profit, Profit (Or Loss)

Premier League Transfer Profit

Premier League clubs due to this made profits on their sales of £247m after selling players for £353m, a 70% return on investment.

When players are sold, as seen above, this may not lead to amortisation costs savings if the players amortisation costs were low due to the price paid or they have been at the club a long time.

This doesn’t mean they receive nothing, as the amount earned is recorded as a profit on player sales. This is recorded as the transfer fee received minus their remaining value as explained in the introduction. However, to avoid you having to scroll up, here is an example from this season using Courtois.

Courtois cost Chelsea £8m 7 years ago on a 5-year contract, costing the club £1.6m a year initially. Each year he is worth less of his transfer fee, so after 1 year he is worth £6.4m and after 2 years £4.8m etc. After 5 years he is worth essentially zero, at this point when he is sold the transfer fee received is all profit, so Chelsea record a profit of £31.5m.

Clearly the biggest benefiters here were Leicester after their sale of Mahrez was essentially all profit and hence the club recorded a profit of £67.1m.

Chelsea also benefited as described above, whilst Watford were the only other club to record a profit of more than £30m after their sale of Richarlison.

Everton were one of only two clubs to make a loss after the costly purchases of Klassen and Funes Mori who they both made a loss on after buying them recently and then selling on the cheap. Leading to a loss of £3.8m.

Arsenal also made a loss on the flop transfer of Lucas Perez, diluted slightly by the sale of academy graduate Akpom.

Burnley, Cardiff, Crystal Palace and Tottenham made no transfer sales and hence recorded no profit or loss this year.

The Summary – The True Cost

Premier League True Transfer Cost

To work out the true cost of this transfer window we use the following formula:

Additional amortisation costs – Amortisation costs saved -/+ Profit/Loss on player sales.

This gives an interesting picture for Premier League clubs with a net transfer costs of minus £13.9m! Meaning Premier League clubs as a whole have saved on transfers this year from a Financial Fair Play perspective.

This is heavily skewed due to the net savings made by Leicester, Watford and Newcastle in particular.

Leicester, due to the Mahrez deal have made a saving of approximately £50m after their new signings, while Watford and Newcastle have also saved in excess of £20m.

Both Manchester clubs are in the black after making one big purchase each and selling a couple fringe players.

Chelsea are also in the black after selling Courtois.

Fulham have the highest cost of £20m after their sensation transfer window in which they spent hugely for a Premier League newcomer, making a statement on their ambitions.

Liverpool were unsurprisingly up there with a net cost of £18m. Everton and Arsenal were the only other clubs with a net cost exceeding £15m.

To put this all into perspective there is a mismatch. The profits received are all given in the period of sale, while new transfers are spread over their contract. This means that Chelsea, despite making a profit on Courtois, and hence their net costs are negative, will indeed see amortisation costs rise in the long run as next year they will not have that Courtois profit.

The same is the case for amortisation costs saved, for some of the players sold, they may only have had one more year of amortisation costs and as such this saving will not be there next year and hence they will see amortisation costs rise the following year.

Amortisation costs have risen over the years and will continue to as long as clubs net spends are still as large as they are.

I hope you found this article insightful, share with a friend!

Please follow and like us:
error

Burnley Financial Review 2018

Burnley Financial Review 2018

Burnley were back in the big time in 2017, returning to the Premier League after a 1 year absence and this time securing Premier League safety with a 16th placed finish, learning from their previous failed attempt under Sean Dyche.

With this being the only aim of the season, a run to the FA Cup Fifth Round was a welcome boost and they will be hoping for lengthier cup campaigns in the future as the look to consolidate their stay in the Premier League this time around.

Returning to the Premier League also yielded a return to profitability after a loss in their sole campaign back in the Championship, recording a £22.2m profit this year.

Lets delve into the numbers.

Burnley Profit:Loss

Revenue Analysis 

Burnley Revenue

Burnley saw revenue soar by mouth watering numbers, more than tripling from £40.0m to £121.2m (203%) after promotion, with revenue increasing in all areas.

Broadcasting revenue was the biggest mover, increasing from £29.6m to £105.0m (255%), showcasing the sheer wealth available in the Premier League. This was supplemented by additional FA Cup revenue after a solid cup run.

Matchday revenue also rose from £6.6m to £8.2m (24.2%) as the club were able to charge higher ticket prices, while attendances also grew as fans flocked in excitement to see their team in the Premier League again.

Commercial revenue also grew to the delight of those in charge, more than doubling from £3.8m to £8.0m (111%) after a successful commercial campaign, exploiting their return to the Premier League. Adding commercial revenue to a club’s sizeable Premier League TV money is key to gaining a financial edge, something Burnley have realised and our aggressively targeting.

Burnley will see revenue balloon again after an incredibly successful season with a top 8 finish expected at the bare minimum, an improvement of 8 places on last season which will yield significant more Premier League prize money whilst they also made it to the FA Cup Fifth Round again.

Burnley will also have the added benefit of potentially playing Europa League football next year which may aid an increase in commercial revenue too.

Expense Analysis 

Burnley Operating expenses

Burnley learned from previous failed Premier League campaigns that securing survival on a shoestring budget is difficult if not impossible and decided to be a bit more risky in their attempts to stay a Premier League club this time around. Expenses rose from £57.7m to £95.8m (66%) whilst maybe more interestingly, doubled from their previous campaign where expenses were only £43.2m.

Amortisation costs rose hugely due to player investment, more than doubling from £10.2m to £22.4m (120%).

The club also have minimal debt and hence minimal finance expense which fell further still, decreasing to £45k from £55k (11.1%)

Burnley Wages

Wages shot up as the club looked to attract the talent to keep them in the Premier League, wages rose from £38.4m to £61.2m (59.4%). This works out at a huge extra £438k a week for Burnley.

It must be noted that last year wages included the exceptional costs of their previous promotion which brought their players and staff big bonuses, this amount came in at £11.3m. Excluding these one-off costs from wages means wages actually increased by a huge 126%, working out at an eye watering extra £656k a week.

Wages also more than doubled the £29.4m they spent in their previous Premier League campaign after the club introduced a new wage structure to ensure they could be more competitive this time around.

Burnley paid no tax this year due to unused losses.

Burnley interestingly did not pay a salary to any of their directors who instead own shares in the company that may prove more valuable in the long run.

Transfers Analysis 

Burnley Net Transfer Spend

Burnley had a positive net spend for the third consecutive year, more than tripling the net spend of their previous Premier League campaign with 6 players joining the club whilst only 1 player left.

In came Brady (£13.6m), Hendrick (£10.6m), Defour (£7.7m), Westwood (£5.2m), Gudmundsson (£2.7m) and Pope (£1.2m) for a combined outlay of £41.0m.

Jutkiewicz was the only departure, leaving the club for £1.1m.

This led to a net spend of £39.9m, a monumental 787% increase on last year’s spend of £4.5m and more than triple the £11.4m spend in 2015.

All of Burnley’s signings positively contributed to their survival and will be classed as good signings by the shrewd Sean Dyche.

Due to only 1 departure, the club ended up making a profit on disposal of £1.3m, slightly more than the fee received for Jutkiewicz, this was compared to a £11.9m profit last year, a 89.1% drop.

Burnley paid out cash of £39.7m in purchasing these players, a significantly bigger outlay than last year’s £11.4m whilst the Burnley received £8.4m in cash, an increase on the £6.6m received last year as club’s settle their debts to the club.

Burnley also potentially owe another £7.1m to clubs should their players meet certain clauses agreed when the transfers took place.

Asset/Liabilities Analysis

Burnley Net Debt

Burnley are an incredibly well run club, improving their net cash position immensely during the year after cash levels boomed.

Cash more than tripled from £6.3m to £20.1m (219%) after increasing profits, transfer fees incoming as well as a tax refund from the government of £5.1m.

Burnley’s little debt halved during the year from £0.4m to £0.2m as the club continues to remain pretty much debt free.

This led to Burnley having a much improved net cash position of £19.9m from previous levels of £5.9m (237%), given the club significant room for manoeuvre should they want to expand – especially with a potential Europa League campaign next season.

As part of this, Burnley have already committed to spending £11.8m on improving the club’s facilities.

Thanks for reading, share with a Burnley fan!

Please follow and like us:
error

You’ve Been Sponsored

You've been sponsored

Sponsorship revenue is a major source of income for premier league clubs and has been increasing year on year. Commercially vital to clubs, major sponsorships provide revenue of a long period due to the contracts usually being over a few years. This year club sponsorships brought in £282 million in revenue for premier league clubs before taking into the various partnerships they also delve into. This article will will go into detail about the types of industries that are attracted to invest and sponsor football clubs. We will also look at kit manufacturers and the role they play in football finance.

Football sponsorship has changed immensely over the years. Looking at the last 11 years (2007 – 2017), Beer has diminished as a large purchaser of sponsorships with no current club having a beer manufacturer as a sponsor. Betting companies have dominated as of late with a high of 9 companies donning sponsorship deals in 2016/17 season, nearly half of all clubs. This makes perfect sense being that football fans represent a key audience for betting companies. Interestingly, this space is not dominated by the largest, most well-known betting companies (other than Bet365 and BetWay), rather overseas and casino gambling companies being the most keen sponsors. It would be interesting to see if the likes of Paddy Power and Ladbrokes decide to enter this space in the future.

Premier League Sponsorship Companies

Financial services companies are aiming to fill the gap left since Barclays no longer sponsor the Premier League. Banks, Insurance and pay-day loans companies are all present here and the financial sector has been ever present in the sponsoring premier league clubs, with at least 3 on average in each of age last 11 years.

Airlines are another major part of the football clubs with two of the largest clubs, Arsenal and Manchester City representing the industry. Both have long standing partnerships with their respective airline.

Other industries to have sponsored Premier League clubs over the years include Sports fashion, Charities, Automobiles and confusingly a Zoo!

Premier League Shirt Sponsorship

As mentioned, sponsorships are a huge source of cash for the clubs with over £282m coming from shirt sponsors alone. Above we have the league table of shirt sponsors. It has a very familiar look to it, with domination from the top 6 who take home over 75% of sponsorship revenue. Man United show their dominance as the most reputable club in English football if not the world, with their Chevrolet deal bring them a handsome £47m a year. While newly promoted Huddersfield and Brighton at the foot of the table with deals of £1.5m each, more than 30 times less than Manchester United.

West Ham can be pleased at being 7th with their BetWay sponsorship bring in £10m a year, this is due to run until the end of this season and they will be hoping a strong showing in the league this season can lead to a similar, if not larger deal especially with the attraction of such of large stadium and tourist attraction for prospective sponsors.

Leicester have a long term agreement with shirt and stadium sponsor King Power and have yet to really cash in their title heroics through this commercial medium.

Interestingly, all London clubs are in the top half of the table, suggesting their is a preference among sponsors to pay a premium to sponsor London clubs, with Crystal Palace above the likes of Newcastle, Leicester, West Brom and Southampton.

Please Stay!

In terms of turnover of club sponsorships, only Tottenham of the Premier League ever-presents has had more than 2 sponsorships, with 6 in the 11 years analysed. Only Arsenal however have not changed sponsors during this  period, however most of these changes were after a long period with that sponsor and we suspect their current deals to continue for the foreseeable future. West Brom have a record high of 7 sponsors in 9 years (including 1 year with none), this is interesting as to whether this indicates poor commercial success or just a policy of renewal. This doesn’t seem to be working with their current deal the 4th worst in the league ahead of only newly-promoted Brighton and Huddersfield, and Burnley.

Kitted Out

Premier League Kit Deals

Kit manufacturer income is another major source of sponsorship income, many large sport brands pay millions to create kits for clubs, profiting from the sales of these. The largest two manufactures are the most well known sports brand in the world, Adidas and Nike. Adidas have seen a huge decline however since their high of 9 kits in 2013 to only 3 in 2017, even losing Chelsea who cut their sponsorship short to sign for Nike last season, paying £67m in the process. The spread of sport companies has diversified in recent years with none dominating as was the case with Adidas, Nike and Umbro in previous years. Umbro were previously a huge producer of kits, making 6 kits in 2007, the largest at that time to none in 2013 before renewing their presence recently with 3 currently rocking the diamond on their kits.

It will be interesting to see how Adidas react to their recent fall, they may decide to attract a large club such as Arsenal to their ranks after missing out on Manchester City who have agreed a deal with Puma for next season.

Speaking of Puma, they lead the way this year for clubs wearing their brand, which has been on a steady increasing trend since 2007.

Premier League Kit Deal Income

There is the usual pattern for Kit makers as there is in performance in domestic leagues, the top 6 dominate due to their domestic success and the large fan bases that come with that. The top 6 take home a remarkable 89% of income generated from kit manufacturers.

Surprisingly, Manchester City lag their domestic rivals significantly in the value of their deal with Nike, coming in at only £12m a year compared to the £75m Adidas deal of their Manchester rival or £60m a year deal of Chelsea who also have their kits made by Nike, something that will be rectified once Puma take over in the summer in a £50m a year deal.

Data was unavailable for Huddersfield and Brighton, however we suspect their deals to be around the £1m mark, maybe lower than Bournemouth who are bottom with an £800k annual deal.

Sleeves of Gold

A new phenomenon among premier league clubs is the introduction of sleeve sponsorships, with 17 out of the 20 premier league teams (Arsenal, Manchester United and Tottenham are yet to have one). This has brought in on average £3m a year extra revenue to premier league clubs, for example Liverpool Western Union deal has brought in £5m a year to the clubs coffers. Chelsea have the largest sleeve sponsor deal to date, with an extra £8m year brought in, while at the other end of the scale Huddersfield only bring in £300k in extra revenue from their sleeves.

Premier League Sleeve Sponsors

I hope you enjoyed this article, please share and like us on Facebook and Twitter.

Please follow and like us:
error

Matchday Money – Gameweek 20

Matchday Money Gameweek 20

Welcome to the first in a new series where we estimate the matchday gate receipts taken at all premier league games each week. We will compare the revenue generated between teams and compare their strategy for maximising matchday revenue.

The revenue is calculated based on an average of the highest and lowest prices offered to club members for each match. This amount is then multiplied by the number of tickets available for sale which for home teams is attendance less away ticket allocation and season tickets sold. Away teams is simply the away ticket allocation multiplied by the away ticket price. A separate article will analyse the season ticket revenue taken by each club.

The away allocation differs from game to game with it up to negotiation between the clubs. The lower of 10% of stadium capacity or 3,000 seats must be offered to away teams on each matchday, however this is not always taken up as clubs analyse the demand for the game among their fans and choose accordingly.

Here are the matchday results for gameweek 20:

Bournemouth 3 – 3 West Ham

Chelsea 2 – 0 Brighton

Crystal Palace 2 – 3 Arsenal

Huddersfield 1 – 1 Stoke

Liverpool 5 – 0 Swansea

Manchester United 2 – 2 Burnley

Newcastle 0 – 1 Manchester City

Tottenham 5 – 2 Southampton

Watford 2 – 1 Leicester

West Brom 0 – 0 Everton

Gameweek 20 Analysis

Premier League Matchday 19 Stadium Attendance

Chelsea led the way in stadium capacity percentage with 99.8% of the stadium filled as 41,568 fans flocked to their boxing day fixture, closely followed by Newcastle fans who watched their team play league leaders Manchester City. Unsurprisingly, Manchester United’s attendance of 75,046 was the highest by a distance with Tottenham second nearly 20,000 behind despite a stadium capacity percentage of 61.6% in their temporary 90,000 seater home.

Premier League Gameweek 19 Matchday Revenue

Despite their lowly stadium capacity %, Tottenham led the way with gate receipts with takings of over £1.3m, in part due to their high ticket prices of £55 and the fact they only sold 28,000 season tickets for Wembley, meaning a more matchday tickets on sale equating to a higher taking each matchday.

Premier League Matchday 19 Home Revenue

Liverpool’s season ticket sales of 25,000 also allow them to benefit from more expensive matchday tickets. Manchester United and Chelsea complete the top 4 this week with Manchester United’s lower due to the 55,000 season tickets sold. These amounts are more secure, so there is always a trade off between the guaranteed selling of season tickets and the potential for empty seats on matchday.

Bournemouth’s 11,360 seat stadium, combined with season ticket sales of 7,000 mean their takings from games are low, something they will be hoping to rectify after stabilising in the Premier League.

Premier League Matchday 19 Away Revenue

For away teams the revenue is usually fairly balanced, with the away allocation always fairly similar. All premier league teams agreed to cap away ticket prices to £30, with Arsenal even taking it a step further at £26. Southampton playing away to spurs were allocated the full 3,000 meaning they lead the way in away matchday revenue, followed closely by Brighton, Burnley Manchester City and Swansea – who all played teams with stadium capita of over 45,000. West Ham lag the rest by far, playing at the smallest stadium in the top flight by far, Bournemouth’s Vitality Stadium which boasts 11,360 seats. West Ham were only given an allocation of 2,000 seats.

Thats it for the first week of this matchday money series – any feedback would be greatly appreciated as we continue to refine the formula to get as accurate a read on matchday takings.

Please follow and like us:
error