Brighton 2019 Finances Predicted – Seagulls Survive (Just)

Brighton 2019 Financial Predictions

Brighton entered their second successive season in the Premier League wary of the infamous ‘second-season syndrome’ and they were worried for much of the season as the club hung around the drop zone for the majority of the season.

A terrible run of form towards the end of the season led to some tense, nail-biting situations, however a few points were plucked here and there, and Brighton managed to stay up by the skin of their teeth in 17thplace and secure a third Premier League season.

A run to the FA Cup Semi Final was a welcome boost to the club with relegation never far away.

The season wasn’t without its casualties, with Chris Hughton losing his job after performing admirably during his time there but a breath of fresh air was needed for everyone around the club.

This article aims to predict how last season affected Brighton and their finances and what the future holds.

Let’s delve into the numbers.

Revenue Prediction

Brighton 2019 Revenue Prediction

Matchday Revenue

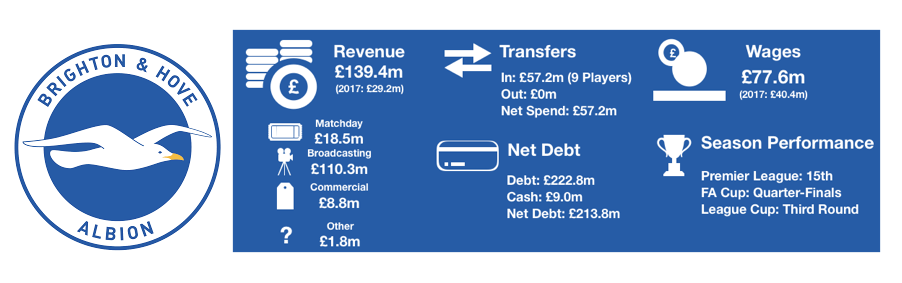
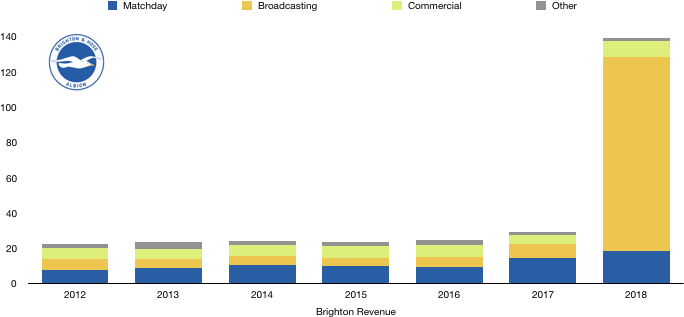
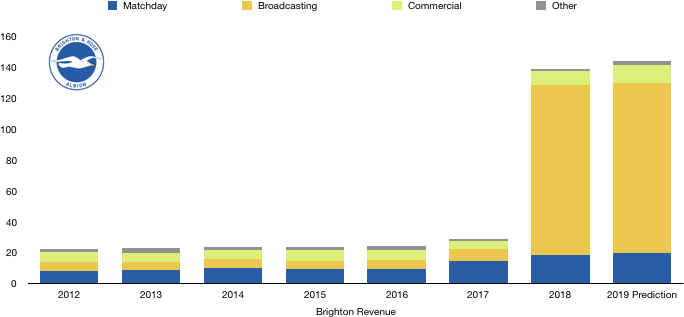
Brighton have fairly high matchday revenue for a club their size at £19m which saw a sizeable boost following promotion.

This season, matchday revenue should remain robust at a similar mark, especially considering the club had 22 home games once again. 

The FA Cup Semi Final at Wembley will boost matchday revenue so a slight increase to £20m seems an adequate prediction given average attendance increased by a whole 19 people to 30,426 in 2019.

Broadcasting Revenue

Premier League Payments

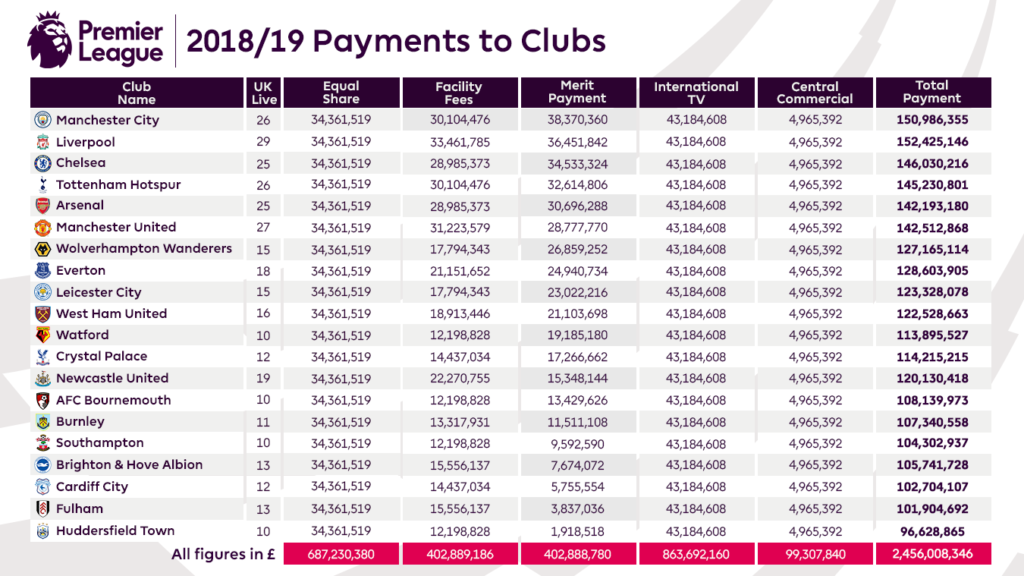
Brighton’s broadcasting revenue was £110m in 2018, of which a huge £108m related to Premier League TV payments after finishing 15thin the Premier League.

Despite increased distributions overall in the Premier League, a drop of two places to 17thmeant that Brighton saw their Premier League revenue drop £2m to £106m. Brighton featured in the same number of live games as they did in 2018 (13).

However, a magical run to the FA Cup Semi-Final and Wembley boosted revenue by around £1.6m in prize money as compared to their Quarter Final appearance in 2018, essentially eliminating the fall in revenue from their lower Premier League position.

The League Cup offers silverware and not much else so an earlier second round exit will not materially affect finances.

Therefore, overall, we expect broadcasting revenue to remain at £110m as their FA Cup run minimises the impact of their fall in Premier League revenue.

Commercial Revenue

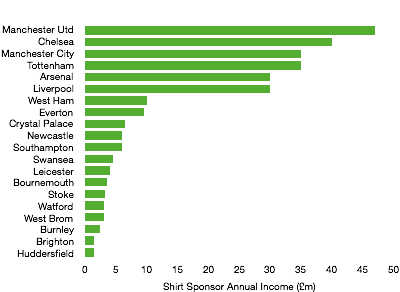
Brighton have one of the lowest commercial revenues in the Premier League, lower than some Championship clubs even.

However, their continued presence in the Premier League will continue to boost revenue, which increased from £5m in 2017 to £9m last year.

Survival means that this trend will continue and a rise to around £12m should be easily achievable, with rises in excess of this dependant on survival bonuses and further commercial activity.

The rise is unlikely to be much higher than this due to their ongoing contracts already in place with Nike and America Express which are their most lucrative deals.

Other Revenue

Brighton had other revenue of £2m in 2018 and are best guess here is it will remain at this level with not much else to go to predict this amount.

Total Revenue

A steady year for Brighton means revenue will not change a great deal however we predict that on the basis of matchday and broadcasting revenue remaining at similar levels to last year, commercial revenue growth will help Brighton to increase revenue by around £4m to £143m from £139m in 2018.

Survival is obviously the main goal with around 75% of Brighton’s revenue dependant on Premier League survival. This revenue will make it possible for Brighton to continue investing into the club and players.

Cost Prediction

Brighton 2019 Costs Prediction

Amortisation

Brighton had a big summer, spending just shy of £80m on new players in 2019, having already spent £57m in the previous summer to stay up.

Brighton signed an astonishing 14 players with the standouts being club record signing Jahanbaksh (£17m), Bissouma (£15m), Bernardo (£9m) and Montoya (£6m) as they went on a spending spree.

This spending, something Brighton are not accustomed too, is likely to increase amortisation from £19m to £35m, based on transfer fees and contract lengths.
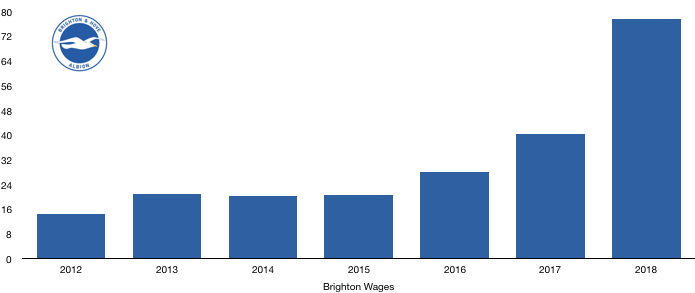
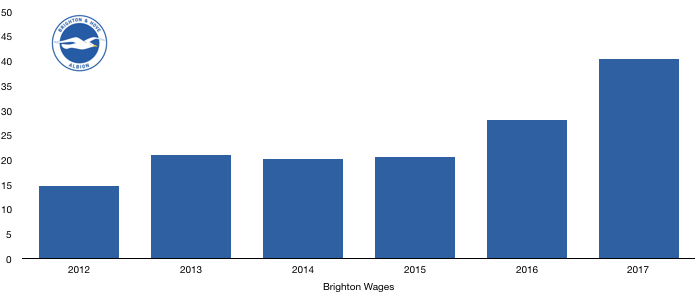
Wages

Brighton 2019 Wages Prediction

Brighton commendably have one of the lowest wage bills in the Premier League and despite this spending, that is likely to still be the case. Despite a host of new signings, many went out on loan with wages being recouped with the first team additions all being on relatively humble wages compared to their Premier League rivals.

Based on this, an increase from £78m to £95m is possible, however I suspect they will not break the £100m barrier this season, although it won’t be far away with the costs to compete in the Premier League growing at an astonishing pace.

Other Costs

Brighton’s other expenses to run a Premier League were £33m in 2018 following promotion, 2017 was much lower due to being in the Championship so a further jump of around £5m to £38m is likely.
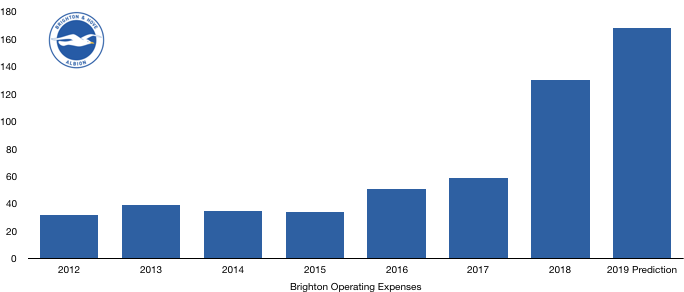
Total Costs

It was an expensive year for Brighton as they successfully battled for their Premier League place and it did come at a cost, with total costs likely to increase from £139m to around £168m based on the above.

These costs are likely to continue rising as they remain in the Premier League with the costs of the Premier League continually rising.

Transfer Analysis

Brighton 2019 Transfers

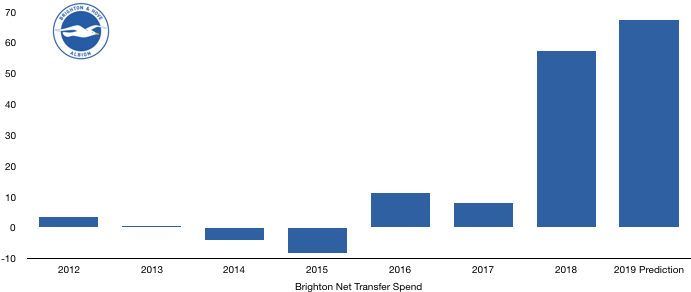
Last summer was the biggest summer in Brighton’s history as they spent huge sums they have never spent before.

In came Jahanbaksh (£17m), Bissouma (£15m), Bernardo (£9m), MacAllister (£7m), Montoya (£6m), Andone (£5m), Button (£4m), Burn (£3m), Tau (£3m), Mlakar (£3m), Baluta (£3m), Dreyer (£2m), Gwargis (£1m) and Arce (£1m) for a combined £80m.

Out went Baldock (£4m), Goldson (£3m), Norwood (£2m), Murphy (£1m) and Skalak (£1m) for a total £12m.

This meant Brighton had their highest net spend in their history at £68m, eclipsing the £57m net spend in 2018.

Brighton also recorded a measly profit on player sales of £3m in 2018. 2019 is likely to be a little bit higher due to increased sale activity and based on transfer fees paid and received on these departures and their original contract lengths, a profit of around £10m is likely, a £7m increase.

Based on the 2018 accounts, Brighton were owed a measly £2.9m in transfer fees with only £1.5m due in 2019, which will hardly help given their large spending.

In contrast, Brighton owe clubs £19m in transfer fees with £10m due in 2019, a net creditor position of £8.5m, adding to last summer’s outlay.

This is likely to mean their cash levels of £9m in summer 2018 are likely to fall.

Profit/Loss Prediction

Brighton 2019 Profit Prediction

Based on all of the above, despite a small rise in revenue being predicted and an increase in profit on player sales, the rise in the costs of competing in the Premier League significantly outweigh this and a £11m profit in 2018 is likely to turn into a loss of around £15m.

The increased spending and wages are to blame for this; however, such spending was required to show ambition, and more importantly, survive.

2019/20 poses to be an interesting season for the club under a new regime under the impressive Graham Potter who will bring his own ideas and needed his own players, leading to another expensive summer window where the club spent over £60m, showing that costs are only going to continue rising as long as Brighton remain in the Premier League, something they would very much like to do.

I hope you enjoyed this article! Share with a Brighton fan and look out for when the actual finances are released to see how we fared!

Please follow and like us:
error

Brighton & Hove Albion’s 2018 Finances – Seagulls Soaring

Brighton & Hove Albion's Finances 2018

Brighton enjoyed their first-ever season in the Premier League. A 15thplaced finish exceeded many people’s expectations and a solid FA Cup run meant it was an unforgettable season for Brighton fans.

Brighton’s newfound Premier League status yielded huge boosts to their finances as the club recorded their first profit in years at record levels of £11.3m after recording a loss of £38.9m last year, showcasing the riches available in the Premier League.

Let’s delve into the numbers.

Brighton Profit:Loss 2018

Revenue Analysis

Brighton 2018 Revenue

Brighton saw their revenue soar to record heights, rising from £29.2m to £139.4m (377%) as the riches of the Premier League flowed into the club.

Matchday revenue rose from £14.8m to £18.5m (25%) as attendances grew on the back of promotion from 27,966 to 30,403 (9%) and ticket prices also rose, boosting matchday takings considerably. A run to the FA Cup Quarter Finals also boosted revenue by providing two extra home games.

Broadcasting revenue increased by over £100m, rising from £7.7m to an eye-watering £110.3m (1,332%). The Premier League really showed the reason for its tag as the richest league in the world by this astronomical rise in revenue for Brighton.

Brighton were shown on TV for 13 Premier League games and achieved a solid 15thplaced position, while they also reached the FA Cup Quarter Finals which further boosted their broadcasting revenue.

The new Premier League status of Brighton yielded new opportunities for commercial growth which they took full advantage of. Commercial revenue increased from £5.1m to £8.8m (73%), a figure that should only grow as long as Brighton stay in the Premier League.

Other revenue increased from £1.6m to £1.8m (13%).

Looking ahead Brighton should see another rise in revenue this season. Matchday revenue should increase slightly due to their run to the FA Cup Semi-Final and increasing attendances. Broadcasting revenue should increase due to their FA Cup exploits, however should they finish 16thor lower, revenue may actually fall. Brighton’s commercial revenue should increase to £10m+ otherwise it would have been a disappointing commercial campaign. 

A target revenue of £145m sounds reasonable, with the hope of pushing past the £150m barrier a possibility.

Costs Analysis

Brighton Costs 2018

Brighton saw their costs more than double, soaring from £59.0m to £130.0m (120%). This rise in costs still paled in comparison to the rise in revenue, meaning profitability was strengthened significantly. 

Player investment on promotion was apparent due to amortisation more than tripling, increasing from £6.3m to £19.3m (206%). Brighton made sure they were Premier League ready by recording their largest ever transfer spend.

Costs also rose due to investment in the women’s squad (part of the above amortisation) and investment in club facilities (which increased depreciation significantly).

Brighton also saw facilities damaged or that were no longer fit for purpose, which led to an impairment of £1.9m on certain equipment and facilities.

Brighton also had interest charges of £785k in the year due to interest on transfer fees which were not yet paid after negotiating instalments on their recent transfers.

A tax charge of only £0.8m was paid in the year, an effective tax rate of 6.6%. This is mainly due to Brighton being able to offset this year’s profit with previous losses the club recorded to reduce their tax liability.

Brighton Wages 2018

Wages nearly doubled, increasing from £40.4m to £77.6m (92%) as new Premier League ready players attracted Premier League level wages while current players were rewarded with new, lucrative contracts and bonuses.

The increase in wages cost Brighton an eye-watering extra £715k a week, a huge sum for a club the size of Brighton, although not unusual when clubs are promoted to the Premier League for the first time.

Directors saw a modest rise in salary despite survival, as remuneration rose from £1,673k to £1,855k (11%). Their CEO, Phil Barber, has attracted interest from other Premier League clubs so Brighton may be forced to increase this substantially this year to hold onto their talented CEO.

Looking ahead, Brighton’s costs are only going to increase as long as the club remain in the Premier League. New players will attract higher wages year by year while higher transfer fees will increase amortisation as well. 

Transfers Analysis

Brighton Net Transfer Spend 2018

Brighton had a busy transfer window of incoming players, with 9 players joining. Surprisingly, Brighton did not sell any players for transfer fees in the season (although Murphy and Goldson left in June before the end of Brighton’s financial year, affecting finances slightly).

In came Locadia (£15.3m), Izquierdo (£13.5m), Propper (£11.7m), Ryan (£5.4m), Suttner (£4.1m), Gross (£2.7m), Schelotto (£2.7m), Norman (£1.3m) and Ahannach (£0.5m) for a combined £57.2m.

With no outgoings, Brighton recorded a record-breaking net transfer spend of £57.2m, their third successive net transfer spend.

All the signings contributed to their Premier League survival with Gross proving to be one of the signings of the season while Propper, Ryan, Izquierdo and Locadia all impressed.

Brighton recorded a profit on player sales of £3.4m as the 2018/19 summer transfer sales of Goldson and Murphy were completed in June, before the end of Brighton’s financial year so was included in their finances despite not relating to the 17/18 season.

In cash terms, Brighton saw a huge outflow in cash as they spent £41.7m in cash and only received a measly £0.7m.

Brighton also owe a further £19.0m (of which £9.9m is due this year) while they are only owed £2.9m (of which £1.5m is due this year), a net position of owing £16.1m (of which £8.4m is due this year).

Although not ridiculously large, this may still affect future transfer plans.

Brighton could also potentially owe a further £6.3m if certain transfer clauses are met, although they could potentially be due £3.3m themselves if certain transfer clauses are met in their favour.

Debt Analysis

Brighton Net Debt 2018

Brighton’s first-ever Premier League season saw a huge increase in their cash reserves, taking them from an overdraft of £16.2m to having actual cash of £9.0m, a £25.2m swing.

This improvement in cash was largely due to the astronomical rise in revenue and the profit this brought. This cash was largely committed to transfers (£40m) and improving the club facilities (£10m). This did need a bit of funding, and their owners obliged by providing a loan of £32m.

The above mentioned loan from their owners of £32m increased their debt from £190.7m to £222.8m (17%) as A G Bloom provided further interest-free loans to Brighton to help their successful survival battle. This huge £223m of investment to date shows the huge sums it can take to bring a club to the Premier League.

However, this is only the start and further investment is likely to be needed to keep Brighton in the Premier League.

Net debt rose slightly, increasing from £206.9m to £213.8m (3%) as the rise in cash was bested by the rise in owner debt. Brighton are well on their way to becoming a sustainably run club, although their Premier League status is paramount to this goal.

There is still some way to go and further investment will be required before they are self-sufficient which is likely to take another 3/4 years of Premier League football. The current investment and funding is being spent wisely, improving both the playing squad’s quality and the quality of their facilities and as long as this continues, the club are in safe hands.

Thanks for reading – Share with a Brighton fan!

Please follow and like us:
error

The True Costs of Transfers

Premier League True Summer Transfer Cost

The True Costs of the Premier League 2018 Summer Transfer Window

The Premier League transfer window has officially shut with over £1.2bn spent by Premier League clubs ahead of the new season.

Clubs have to be wary of Financial Fair Play when purchasing players to avoid penalties and bans (for more on this click here) and also need to ensure they are running sustainably for their owners etc.

This brings us to this article, which will explain the true costs of transfers from the 2018 summer transfer window explained briefly below:

When clubs sign a player, from an accounting perspective this is not all charged in the year of the transfer as the payments are matched to how the player will be used. So, a player signing for £50m on a 5-year contract is deemed to cost the club £10m a year, known as the amortisation cost. This is the true costs of the transfer per season for the club.

Another key element is player sales. In this regard the profit the club gain is not simply the transfer fee received minus the transfer fee paid, it is the transfer fee received less the remaining value of the player sold. So, for a £50m player on a 5-year contract, he will be ‘worth’ £50m minus the amortisation charges to date, so after two years of charges, the player will be ‘worth’ £30m. Hence, should a player be sold 2 years later for £50m, a ‘profit’ of £20m will be recorded, rather than nothing like many people believe.

This article will analyse each Premier League club’s business and compare to their counterparts.

Due to the availability of data, this excludes the costs of loans and player wages. All transfer fees and contract lengths are via Transfmartk.co.uk. In order to simplify the amortisation costs, we have ignored contract renewals which make the calculation more complex without much added insight.

Let’s Not Talk About Spend, Let’s Talk About Net Spend

Premier League Transfer Net Spend

Premier League clubs had an active transfer window despite its shortening, spending over £1.2bn, receiving only £353m in return, leaving the club with an astronomical net spend of £909m.

This was due to higher spending by certain clubs, with Liverpool leading the way by a distant after investing heavily following their Champions League heartache with Naby Keita, Fabinho, Alisson and Shaqiri joining while only Danny Ward left, leaving the merseysiders with a net spend of £151m.

Fulham became the first promoted club to ever break the £100m barrier after a barnstorming transfer window with 7 players arriving for transfer fees and only 1 leaving. This led to the club having a net transfer spend of £101m with Seri the pick of the players signed.

Fellow West Londoners Chelsea had the third biggest net spend at £92m after breaking the world transfer record for a goalkeeper in the £72m paid for Kepa after losing Courtois to Real Madrid and they also signed Jorginho.

Manchester United and Manchester City had quiet windows with both making one big purchase a piece with Fred joining United (along with Dalot and Grant) and Mahrez joining City.

At the other end of the scale were Watford with a net transfer spend of minus £23m after not reinvesting all of their Richarlison windfall. Newcastle also were in the black after recording a net transfer spend of minus £13m as Mike Ashley used transfer cash received to purchase House of Fraser rather than reinvest in the Toon.

Additional Amortisation Costs

Premier League Amortisation Costs

Premier League clubs face additional transfer costs of £275m this year alone after a huge transfer spend of over £1.2bn, with this cost spread of the players signed contracts which average at just over 4-year contracts.

Amortisation costs are, as explained above, based on transfer spend and contract lengths and as such the costs are higher for larger spends and also higher when contract lengths are shorter. A key example is Kepa, a £72m keeper who signed a 7-year contract, costing Chelsea just over £10m a year. While Mahrez, a £61m purchase on a 5-year contract cost Manchester City more at just over £12m a year despite the smaller transfer fee.

Liverpool unsurprisingly lead the way after their impressive transfer window where they spent £164m with Alisson signing a 6-year contract while Keita, Fabinho and Shaqiri signed 5-year deals. Liverpool will have additional costs of £31m after these deals.

Fulham had the second highest net spend after their £105m 7 player splurge with contracts lengths 4 years on average, bringing amortisation costs of £24m over that period.

Leicester despite their relatively small net spend have a large transfer costs due to their £103m spend with the Mahrez deal diluting their net spend after the club reinvested the Mahrez cash and then some, leading to an amortisation cost of £22m.

Chelsea and West Ham also had large amortisation costs above £20m after their productive transfer windows.

Tottenham were at the other end of scale after an inactive transfer window, becoming the first club since the transfer window came into effect in 2003 not to purchase or sell a player.

Crystal Palace were the only other club to have an additional amortisation cost below £5m.

Amortisation Costs Savings

Premier League Amortisation Savings

Premier League clubs saved £41m on amortisation cost after after player sales of £353m with many players sold either brought cheaply or have been long serving players that no longer attract amortisation costs after staying longer than their original contract.

Amortisation costs savings are driven again by the transfer fee paid when the player was brought and their original contract length. So, for instance Daley Blind signed for Manchester United 4 years ago for £15.8m on a 4-year contract, costing Manchester United just under £4m a year for those 4 years. Now that the 4 years are up, Blind costs United nothing from an accounting perspective, so no amortisation costs are saved and hence no savings included in our calculations.

As such many Premier League clubs didn’t recorded any savings as the players sold had already seen their entire transfer fee amortised. This includes players signed as youths such as Danny Ward at Liverpool or long serving players such as Courtois at Chelsea.

In a couple of situations, players were signed and immediately sold. This was the case for Benik Afobe at Wolves and Mikel Merino for Newcastle. In both these cases the amortisation costs were excluded when calculating additional costs and savings.

Bournemouth were the biggest savers, saving just under £8m after the sales of the after mentioned Benik Afobe to Wolves (before Wolves later sold him to Stoke), Lewis Grabban and Max Gradel.

Everton (£7m), Newcastle (£6m) and Watford (£5.5m) were the only other clubs to save in excess of £5m on player sales after the sales of the likes of Klassen, Mitrovic and Richarlison.

Burnley, Cardiff, Crystal Palace and Tottenham sold no players hence the reason for their lack of amortisation costs savings.

Chelsea, Liverpool, Manchester United, Southampton and West Ham also had no amortisation costs savings despite player sales due to the players sold having been at the club for at least their original contract lengths such as Courtois, Danny Ward, Blind, Tadic and Kouyate.

Profit, Profit, Profit (Or Loss)

Premier League Transfer Profit

Premier League clubs due to this made profits on their sales of £247m after selling players for £353m, a 70% return on investment.

When players are sold, as seen above, this may not lead to amortisation costs savings if the players amortisation costs were low due to the price paid or they have been at the club a long time.

This doesn’t mean they receive nothing, as the amount earned is recorded as a profit on player sales. This is recorded as the transfer fee received minus their remaining value as explained in the introduction. However, to avoid you having to scroll up, here is an example from this season using Courtois.

Courtois cost Chelsea £8m 7 years ago on a 5-year contract, costing the club £1.6m a year initially. Each year he is worth less of his transfer fee, so after 1 year he is worth £6.4m and after 2 years £4.8m etc. After 5 years he is worth essentially zero, at this point when he is sold the transfer fee received is all profit, so Chelsea record a profit of £31.5m.

Clearly the biggest benefiters here were Leicester after their sale of Mahrez was essentially all profit and hence the club recorded a profit of £67.1m.

Chelsea also benefited as described above, whilst Watford were the only other club to record a profit of more than £30m after their sale of Richarlison.

Everton were one of only two clubs to make a loss after the costly purchases of Klassen and Funes Mori who they both made a loss on after buying them recently and then selling on the cheap. Leading to a loss of £3.8m.

Arsenal also made a loss on the flop transfer of Lucas Perez, diluted slightly by the sale of academy graduate Akpom.

Burnley, Cardiff, Crystal Palace and Tottenham made no transfer sales and hence recorded no profit or loss this year.

The Summary – The True Cost

Premier League True Transfer Cost

To work out the true cost of this transfer window we use the following formula:

Additional amortisation costs – Amortisation costs saved -/+ Profit/Loss on player sales.

This gives an interesting picture for Premier League clubs with a net transfer costs of minus £13.9m! Meaning Premier League clubs as a whole have saved on transfers this year from a Financial Fair Play perspective.

This is heavily skewed due to the net savings made by Leicester, Watford and Newcastle in particular.

Leicester, due to the Mahrez deal have made a saving of approximately £50m after their new signings, while Watford and Newcastle have also saved in excess of £20m.

Both Manchester clubs are in the black after making one big purchase each and selling a couple fringe players.

Chelsea are also in the black after selling Courtois.

Fulham have the highest cost of £20m after their sensation transfer window in which they spent hugely for a Premier League newcomer, making a statement on their ambitions.

Liverpool were unsurprisingly up there with a net cost of £18m. Everton and Arsenal were the only other clubs with a net cost exceeding £15m.

To put this all into perspective there is a mismatch. The profits received are all given in the period of sale, while new transfers are spread over their contract. This means that Chelsea, despite making a profit on Courtois, and hence their net costs are negative, will indeed see amortisation costs rise in the long run as next year they will not have that Courtois profit.

The same is the case for amortisation costs saved, for some of the players sold, they may only have had one more year of amortisation costs and as such this saving will not be there next year and hence they will see amortisation costs rise the following year.

Amortisation costs have risen over the years and will continue to as long as clubs net spends are still as large as they are.

I hope you found this article insightful, share with a friend!

Please follow and like us:
error

You’ve Been Sponsored

You've been sponsored

Sponsorship revenue is a major source of income for premier league clubs and has been increasing year on year. Commercially vital to clubs, major sponsorships provide revenue of a long period due to the contracts usually being over a few years. This year club sponsorships brought in £282 million in revenue for premier league clubs before taking into the various partnerships they also delve into. This article will will go into detail about the types of industries that are attracted to invest and sponsor football clubs. We will also look at kit manufacturers and the role they play in football finance.

Football sponsorship has changed immensely over the years. Looking at the last 11 years (2007 – 2017), Beer has diminished as a large purchaser of sponsorships with no current club having a beer manufacturer as a sponsor. Betting companies have dominated as of late with a high of 9 companies donning sponsorship deals in 2016/17 season, nearly half of all clubs. This makes perfect sense being that football fans represent a key audience for betting companies. Interestingly, this space is not dominated by the largest, most well-known betting companies (other than Bet365 and BetWay), rather overseas and casino gambling companies being the most keen sponsors. It would be interesting to see if the likes of Paddy Power and Ladbrokes decide to enter this space in the future.

Premier League Sponsorship Companies

Financial services companies are aiming to fill the gap left since Barclays no longer sponsor the Premier League. Banks, Insurance and pay-day loans companies are all present here and the financial sector has been ever present in the sponsoring premier league clubs, with at least 3 on average in each of age last 11 years.

Airlines are another major part of the football clubs with two of the largest clubs, Arsenal and Manchester City representing the industry. Both have long standing partnerships with their respective airline.

Other industries to have sponsored Premier League clubs over the years include Sports fashion, Charities, Automobiles and confusingly a Zoo!

Premier League Shirt Sponsorship

As mentioned, sponsorships are a huge source of cash for the clubs with over £282m coming from shirt sponsors alone. Above we have the league table of shirt sponsors. It has a very familiar look to it, with domination from the top 6 who take home over 75% of sponsorship revenue. Man United show their dominance as the most reputable club in English football if not the world, with their Chevrolet deal bring them a handsome £47m a year. While newly promoted Huddersfield and Brighton at the foot of the table with deals of £1.5m each, more than 30 times less than Manchester United.

West Ham can be pleased at being 7th with their BetWay sponsorship bring in £10m a year, this is due to run until the end of this season and they will be hoping a strong showing in the league this season can lead to a similar, if not larger deal especially with the attraction of such of large stadium and tourist attraction for prospective sponsors.

Leicester have a long term agreement with shirt and stadium sponsor King Power and have yet to really cash in their title heroics through this commercial medium.

Interestingly, all London clubs are in the top half of the table, suggesting their is a preference among sponsors to pay a premium to sponsor London clubs, with Crystal Palace above the likes of Newcastle, Leicester, West Brom and Southampton.

Please Stay!

In terms of turnover of club sponsorships, only Tottenham of the Premier League ever-presents has had more than 2 sponsorships, with 6 in the 11 years analysed. Only Arsenal however have not changed sponsors during this  period, however most of these changes were after a long period with that sponsor and we suspect their current deals to continue for the foreseeable future. West Brom have a record high of 7 sponsors in 9 years (including 1 year with none), this is interesting as to whether this indicates poor commercial success or just a policy of renewal. This doesn’t seem to be working with their current deal the 4th worst in the league ahead of only newly-promoted Brighton and Huddersfield, and Burnley.

Kitted Out

Premier League Kit Deals

Kit manufacturer income is another major source of sponsorship income, many large sport brands pay millions to create kits for clubs, profiting from the sales of these. The largest two manufactures are the most well known sports brand in the world, Adidas and Nike. Adidas have seen a huge decline however since their high of 9 kits in 2013 to only 3 in 2017, even losing Chelsea who cut their sponsorship short to sign for Nike last season, paying £67m in the process. The spread of sport companies has diversified in recent years with none dominating as was the case with Adidas, Nike and Umbro in previous years. Umbro were previously a huge producer of kits, making 6 kits in 2007, the largest at that time to none in 2013 before renewing their presence recently with 3 currently rocking the diamond on their kits.

It will be interesting to see how Adidas react to their recent fall, they may decide to attract a large club such as Arsenal to their ranks after missing out on Manchester City who have agreed a deal with Puma for next season.

Speaking of Puma, they lead the way this year for clubs wearing their brand, which has been on a steady increasing trend since 2007.

Premier League Kit Deal Income

There is the usual pattern for Kit makers as there is in performance in domestic leagues, the top 6 dominate due to their domestic success and the large fan bases that come with that. The top 6 take home a remarkable 89% of income generated from kit manufacturers.

Surprisingly, Manchester City lag their domestic rivals significantly in the value of their deal with Nike, coming in at only £12m a year compared to the £75m Adidas deal of their Manchester rival or £60m a year deal of Chelsea who also have their kits made by Nike, something that will be rectified once Puma take over in the summer in a £50m a year deal.

Data was unavailable for Huddersfield and Brighton, however we suspect their deals to be around the £1m mark, maybe lower than Bournemouth who are bottom with an £800k annual deal.

Sleeves of Gold

A new phenomenon among premier league clubs is the introduction of sleeve sponsorships, with 17 out of the 20 premier league teams (Arsenal, Manchester United and Tottenham are yet to have one). This has brought in on average £3m a year extra revenue to premier league clubs, for example Liverpool Western Union deal has brought in £5m a year to the clubs coffers. Chelsea have the largest sleeve sponsor deal to date, with an extra £8m year brought in, while at the other end of the scale Huddersfield only bring in £300k in extra revenue from their sleeves.

Premier League Sleeve Sponsors

I hope you enjoyed this article, please share and like us on Facebook and Twitter.

Please follow and like us:
error

Financial Football News Round-Up Edition 10

Financial Football News Weekly Round-Up 10

Here is your weekly financial football news round-up to keep you up to date with all things financial football! This is your round-up for the week commencing 15th January 2018, featuring Newcastle, Manchester United, Huddersfield, UEFA, Chelsea and Brighton.

Brighton Financial Results Released – Analysed by FFN

Brighton 2017 Financial Results

Brighton released their financial accounts for the promotion winning 16/17 season. The accounts saw losses grow by 50% despite record revenue as the club ambitiously sought Premier League football and set to reap the rewards in next years accounts – full analysis here.

Financial Fair Play 2.0?

UEFA Financial Fair Play 2.0

French newspaper Le Parisien are reporting that reforms on Financial Fair Play are looming due to Historically large clubs such as Real Madrid, Barcelona and Bayern dissatisfied with the current rules.

There are various changes being considered with a major one being to limit spending that isn’t matched by increased revenue to EUR 100m. This would be of particularly difficulty to the ‘new rich’ who won’t be a able to spend large sums without a rise in revenues first.

Sanctions to control debt are also under consideration that would specifically target debt heavy Manchester United.

A limit may also be imposed on limiting players at a club to stop the likes of Manchester City and Chelsea stockpiling youth players the loaning them in the hope of profiting in the future.

There is also took of redefining the meaning of ‘related parties’ in order to reduce the ways owners can pump money into the club without raising Financial Fair Play Issues. Manchester City and PSG both have large deals with Etihad and Abu Dhabi respectively, who are both related to their owners.

UEFA are due to vote on a reform on 24th May with a draft report rumoured to have already been created.

Newcastle Sale Stalemate

The long running saga involving the sale of Newcastle by Mike Ashley to Amanda Staveley continues to rumble, with talks currently hitting a roadblock and no sale in sight any time soon after a £250m offer was rejected. The current plight of the troubled Geordie side cannot of given prospective owners much confidence in taking over, with Mike Ashley not wanting to reflect this in his pricing.

This is also a difficult time for the manager Rafa Benitez, who is experiencing uncertainty in terms of transfer money available to spend in a bid to move the club clear of the relegation zone, something their owner will want to do but not a huge costs that will dent any sale proceeds he may gain.

Huddersfield Hydrated By Coco Fuzion 100

Huddersfield Coco Fuzion 100

Huddersfield have announced another commercial partnership with drinks company Coco Fuzion becoming their official hydration partner. The company produces carbonated coconut water drinks that naturally hydrate consumers with the electrolytes it contains.

The brand fits well with the Huddersfield playing style who will need a great deal of hydrating due to the all action pressing style the club implements.

This is the latest in a number of commercial deal Huddersfield have signed, taking advantage of their new found Premier League status.

Oops I Did It Again! – Chelsea Back In Trouble Over Youth Players

Fifa are reported to be investigating Chelsea for the third time in eight years for possible breaches of signing under-age players. The club deny any wrongdoing.

Previously the club have been banned for two transfer windows when in 2009, they were sanctioned for the purchase of Gael Kakuta, the ban was successfully overturned on appeal however.

Fifa have been a lot tougher on such punishments recently with Real Madrid, Barcelona and Atletico all receiving bans in recent years and Chelsea will hope they have not fallen foul of the rules to avoid a similar fate.

Man United Striker SIS Partnership

Manchester United SIS

Manchester United have signed a three-year partnership with Science In Sport (SIS), a sport nutrition company based in Lancashire. This represents another major coup for the company, with Manchester United become the 10th Premier League club to sign with the sport nutritionist.

As part of the deal SIS will provide Man Utd with a dedicated performance nutritionist, as well as installing a Fuel Station within the club’s training ground, giving players and staff direct exposure to SIS products at all times.

UEFA Release Huge Report On Football Landscape

UEFA last week released their annual report analysing the financial performance of all clubs in the 55 UEFA member associations in the 2016 financial year. The report details areas such as fan support, sponsorship, transfers and wages plus more. Stay tuned for analysis of this interesting report over the next week.

Please follow and like us:
error

Brighton & Hove Albion – Financial Review 2018

Brighton Financial Review 2018

Brighton had a truly momentous season, exceeding expectations in all areas to gain promotion back to the Premier League for the first time in 34 years. In doing so Brighton’s losses increased by a remarkable 50% to £38.9m, although £9.1m of this can be attributed to administrative & regulatory costs of readying the club for the Premier League. Revenues rose over £4.6m (18%) to £29.2m.

Spending was required to reach their goals and the club has been rewarded as Chairman Tony Bloom has already commented that “Our annual turnover has been boosted by approximately £100m for the current season”, more than triple current levels.

This article will analyse the different aspects of their financial performance and the investment they put into gaining promotion for a usually conservative club.

Brighton Profit:Loss

Revenue Analysis

Brighton Revenue

Brighton’s revenue reached record levels of £29.2m, up a good 18% from the previous year due to their incredible promotion campaign where they were unbeaten for the first 18 games of the season. This feat helped keep fans coming to their stadium, while attracting commercial attention and also keeping TV cameras on the team for crucial games.

Brighton’s commercial revenue had a modest rise of £400k (7%), with a larger rises expected in the next account once Brighton secure more lucrative partnerships due to their newfound Premier League status.

Being in the promotion race helped Brighton secure more televised matches for their games, leading to a £2.2m rise (36%) rise in broadcasting revenue. Increased prize money and live games will have been awarded to Brighton over the course of the promotion season, boosting these revenues. Brighton Received £7.6m from the Football League last season, this pales in comparison to the riches they will now receive in the Premier League.

Matchday revenues were up £1.3m (14%) as fans flocked to support their teams rise to the Premier League, such exciting prospects always bring in more fans and help the club increase spend by fans on matchday too. Matchday revenues would have risen further if not for poor domestic cup runs, reaching the 4th and 3rd round of the FA Cup and League Cup respectively as they rightfully prioritised promotion.

Expense Analysis

Brighton Operating expenses

Operating expenses rose £8m to £59m (15.7%), this is before taking into account exceptional costs incurred in readying the team for the Premier League of £9.1m, which takes the increases in costs to 33.5%. There are certain Premier League requirements in order to get a team ready for the league such as extra facilities, enhanced pitch quality etc. Since Brighton have been away from the Premier League for so long, the requirements are hence more burdensome and require a significant cost to the team.

Brighton Wages

Wages rose significantly as the club pushed for promotion, seeing new faces join the club with no one important leaving, leading to wages rising 43% to a record £40.4m.

Total staff numbers rose by 18 to 288 (7%), with playing staff and coaches up by 5 to 78 (7%).

Player amortisation costs rose to £6.3m from £3.8m (6%) due to high transfer fees and no significant outgoing transfers, which will have an adverse effect on Brighton’s ability to comply with Financial Fair Play.

Transfer Analysis

Brighton Net Transfer Spend

Brighton had a successful transfer period, bringing in 3 players at a cost of £7.9m, with the highlights being Shane Duffy (£4.7m) and Glenn Murray (£3.2m). Steve Sidwell also arrived on a free transfer, contributing to the significant wage rise.

Brighton goal was to keep their squad together while adding a bit of quality in key areas which they were successful in doing, warding of interest for key players Anthony Knockaert, Lewis Dunk and Dale Stephens. The Chairman highlighted this in the accounts that “Retaining our key players from the previous season was vital, and we rejected significant bids for the trio”.

This resulted in the club selling no players for any transfer fee, releasing Gordon Greer, Iñigo Calderón, Andrew Crofts and Adam Chicksen. This meant no players left for money for the second season in a row.

Interestingly the net spend was lower than their high of last season that built the foundation for their successful campaign this season.

These two seasons marked a change in ambition for the usually conservative Brighton, after three years of minimal spend and this looks to be continuing after spending £42.8m in the summer. They also broke their transfer record three times to sign Mathew Ryan (£5.4m), Davy Pröpper (£11.7m) and then José Izquierdo (£13.5m)

This took Brighton to having the 16th highest net spend of £7.9m, despite not being a Premier League club last season.

Assets & Liability Analysis

Brighton Net Debt

Brighton’s debt level rose considerably in the last year with cash reserves depleted due to rising costs, taking advantage of their overdraft to the tune of £16.2m. In 2016, they had cash of £4.5m, therefore this is a fall of over £20m.

Brighton have little in the way of debt other than to their owner on interest free loans that we will talk about below, with only £140k of such loans last year and the year before.

Tony Bloom, Owner of Brighton has invested a significant amount in the new Premier League club, contributing over £190m of his own cash into the club, and he is beginning to reap the rewards of that investment now.

Over the last year he increased loans to the club of £20.2m, helping the club meet their growing costs as they pushed for promotion. Each year, Tony Bloom has consistently invested between £15-30m, contributing significantly to their journey to the Premier League.

The dip in 2013 can be explained in a similar way to Chelsea’s loans as Tony Bloom converted £40m of loans to equity, amounts he will only regain as the club turn to profit.

This is unlikely to be an issue to the owner Tony Bloom, a Brighton born individual who has great love for the club and is likely to remain at the club for the foreseeable future.

Thanks for reading – Share with your fellow Brighton Fans!


Please follow and like us:
error

Matchday Money – Gameweek 20

Matchday Money Gameweek 20

Welcome to the first in a new series where we estimate the matchday gate receipts taken at all premier league games each week. We will compare the revenue generated between teams and compare their strategy for maximising matchday revenue.

The revenue is calculated based on an average of the highest and lowest prices offered to club members for each match. This amount is then multiplied by the number of tickets available for sale which for home teams is attendance less away ticket allocation and season tickets sold. Away teams is simply the away ticket allocation multiplied by the away ticket price. A separate article will analyse the season ticket revenue taken by each club.

The away allocation differs from game to game with it up to negotiation between the clubs. The lower of 10% of stadium capacity or 3,000 seats must be offered to away teams on each matchday, however this is not always taken up as clubs analyse the demand for the game among their fans and choose accordingly.

Here are the matchday results for gameweek 20:

Bournemouth 3 – 3 West Ham

Chelsea 2 – 0 Brighton

Crystal Palace 2 – 3 Arsenal

Huddersfield 1 – 1 Stoke

Liverpool 5 – 0 Swansea

Manchester United 2 – 2 Burnley

Newcastle 0 – 1 Manchester City

Tottenham 5 – 2 Southampton

Watford 2 – 1 Leicester

West Brom 0 – 0 Everton

Gameweek 20 Analysis

Premier League Matchday 19 Stadium Attendance

Chelsea led the way in stadium capacity percentage with 99.8% of the stadium filled as 41,568 fans flocked to their boxing day fixture, closely followed by Newcastle fans who watched their team play league leaders Manchester City. Unsurprisingly, Manchester United’s attendance of 75,046 was the highest by a distance with Tottenham second nearly 20,000 behind despite a stadium capacity percentage of 61.6% in their temporary 90,000 seater home.

Premier League Gameweek 19 Matchday Revenue

Despite their lowly stadium capacity %, Tottenham led the way with gate receipts with takings of over £1.3m, in part due to their high ticket prices of £55 and the fact they only sold 28,000 season tickets for Wembley, meaning a more matchday tickets on sale equating to a higher taking each matchday.

Premier League Matchday 19 Home Revenue

Liverpool’s season ticket sales of 25,000 also allow them to benefit from more expensive matchday tickets. Manchester United and Chelsea complete the top 4 this week with Manchester United’s lower due to the 55,000 season tickets sold. These amounts are more secure, so there is always a trade off between the guaranteed selling of season tickets and the potential for empty seats on matchday.

Bournemouth’s 11,360 seat stadium, combined with season ticket sales of 7,000 mean their takings from games are low, something they will be hoping to rectify after stabilising in the Premier League.

Premier League Matchday 19 Away Revenue

For away teams the revenue is usually fairly balanced, with the away allocation always fairly similar. All premier league teams agreed to cap away ticket prices to £30, with Arsenal even taking it a step further at £26. Southampton playing away to spurs were allocated the full 3,000 meaning they lead the way in away matchday revenue, followed closely by Brighton, Burnley Manchester City and Swansea – who all played teams with stadium capita of over 45,000. West Ham lag the rest by far, playing at the smallest stadium in the top flight by far, Bournemouth’s Vitality Stadium which boasts 11,360 seats. West Ham were only given an allocation of 2,000 seats.

Thats it for the first week of this matchday money series – any feedback would be greatly appreciated as we continue to refine the formula to get as accurate a read on matchday takings.

Please follow and like us:
error