
Manchester United had what for many would be a good season. However, this is Manchester United and a second-place finish, especially to their noisy neighbours was not the season they had hoped for. This coupled with an early Champions League exit and a runners-up medal in the FA Cup was not good enough.
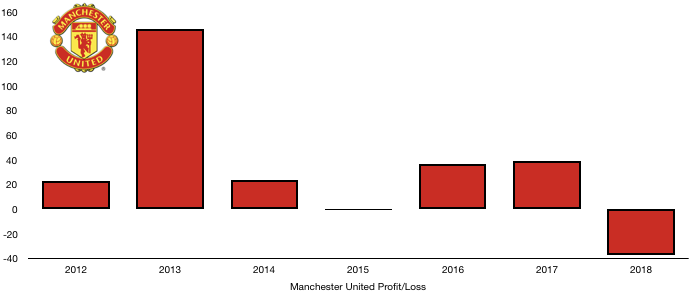
Off the field, financial performance was steady although a disappointing loss after tax was recorded due to changes in US tax law (let’s not go into this), meaning Manchester United lost £37.3m while pre-tax profit more halved to £26.0m.
Alarmingly, this is the first after tax loss since 2015 under Moyes.
Let’s delve into the numbers.
Revenue Analysis

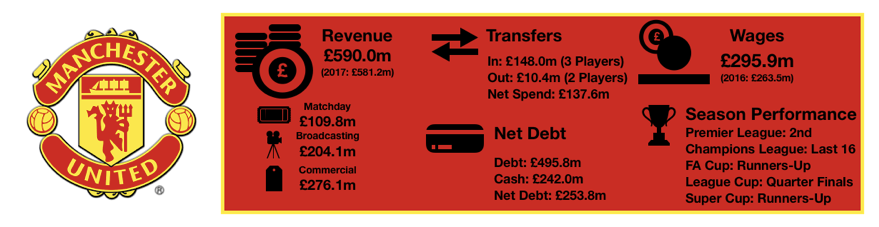
Manchester United’s revenue remained relatively stable, increasing from £581.2m to £590.0m (1.5%) as the £600m revenue barrier continues to elude them. They are still a way clear of their Manchester rivals who just broke the £500m barrier.
Commercial revenue stayed essentially the same, rising from £275.5m to £276.1m (0.2%) on the back of decent growth in their sponsorship portfolio which increased to £173.2m, with Adidas accounting for £79.0m of this revenue. Disappointingly, retail sales fell to £104m as the lack of real success on the pitch led to less merchandise being brought by fans.
Broadcasting revenue rose significantly, increasing from £194.1m to £204.1m (5.2%) as the club were boosted by a second place Premier League finish, netting the club £151.6m while European revenue actually fell as they earned £38.3m despite returning to the Champions League, showcasing how lucrative the Europa League can be (if you win it).
Matchday income dropped, falling from £118.6m to £109.8m (-1.6%) as Manchester United suffered from having less home games than the season before. Manchester United operate at almost full capacity at every home game (>99% in each of the last 20 years) and as such, struggle to raise matchday income with its value derived almost entirely from the number of home games in that season.
Manchester United will be disappointed not to have reached the £600m revenue mark last year, something we thought would have happened and should have if they had progressed slightly further in the Champions League. We expect Manchester United to struggle to meet their target this year also with revenue sources becoming harder to come by with gains to be made on the field more likely to make a difference. This does not seem to be the case at the time of writing with a poorer season than last looking likely and as such we expect any commercial revenue gains to be offset by a poorer performance on the field yielding lower revenue.
Expense Analysis
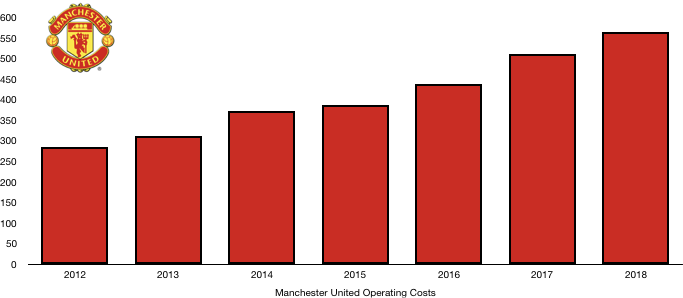
Manchester United’s revenue may not have risen by much but this did not stop operating expenses from doing so as they rose from £511.3m to £564.0m (10.3%), reducing profitability considerably.
A huge reason for this was amortisation which rose from £124.4m to £138.4m (11.3%) as Mourinho invested heavily in a few players to no avail other than to push up costs.
Other operating expenses fell ever so slightly to £117.0m. This consists of commercial costs (£25.9m), matchday costs (£24.2m) and property costs (£21.6m) as well as other smaller general costs.
Net finance costs did however fall from £24.3m to £18.0m (-25.9%) after favourable FX movements saw their repayments fall and interest income rise.
Now to the tax point that has caused a loss this year. To not drive you away from reading on, it’s essentially accounting hocus pocus where a change in the tax regime in the US (where Manchester United pay tax) means they will pay more tax at a later date, this has to be recorded in part this year hence there was a £48.8m deferred tax expense which caused the loss.
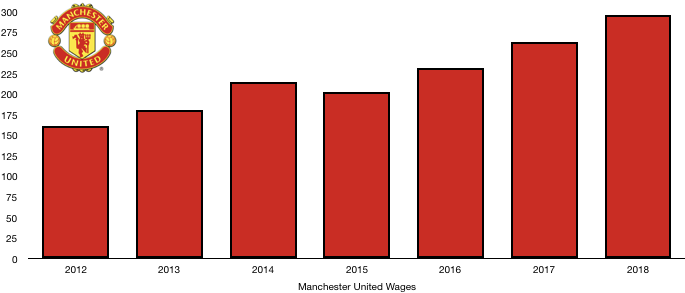
Wages were the biggest culprits to their rising costs, increasing from £263.5m to £295.9m (12.3%). The main reason given was salary uplifts due to a return to the Champions League while the new marquee signings of Lukaku and Sanchez would have also burnt a hole in the pocket. These extra wages work out as an additional £623k a week.
Included within wages are payments of £12.9m to directors in the company with the majority of this going to Ed Woodward, this was a £600k increase on last year.
Expenses are likely to rise slightly again next year. Manchester United only made one major signing while they also let go of a couple players to negate this, a small drop in operating expenses to £550m is also a possibility.
Transfers Analysis
Mourinho’s policy going into last year transfer window was to target their weak areas and buy the very best in those positions. The club ran into difficulties obtaining his number one targets, and this led to only 3 signings rather than the 4 he originally hoped for.
In came Lukaku (£76.2m), Matic (£40.2m) and Lindelof (£31.5m) for a combined £147.9m spend.
Departing were only Januzaj (£7.7m) and Pereira (Loan – £2.7m) for a combined £10.4m.
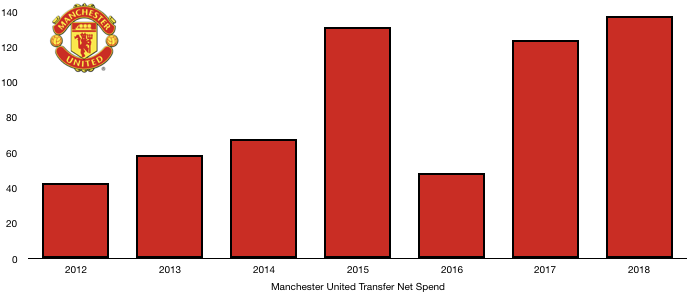
This meant Manchester United had a huge net transfer spend of £137.6m, up 10.9% on last year.
This also doesn’t include the swap deal of Sanchez for Mkhitaryan where no cash swapped hands.
The signings of Lukaku and Matic were a success. However, they were not enough to compete with Manchester City and in Europe with Lindelof turning out to be a poor signing.
Alarmingly Manchester United owe clubs an eye-watering £258.3m in transfer fees with £156.2m of that due in the next year, possibly explain the lack of transfers this summer.
In comparison Manchester United are only owed £29.2m in transfer fees with only £4.7m of that owed this year, leaving a net of £151.5m owed to club’s this year.
It doesn’t stop there as Manchester United may owe a further £58.2m should certain contingent transfer conditions be met.
This is after an already heavy cash outflow last year, where £155m left the club’s coffers and only £46.9m came in from transfers in cash terms.
It is yet to be seen whether this heavy transfer debt burden is the main reason for a lack of spending or whether it really was due to a differing in transfer policy opinion between Mourinho and Woodward.
Net Debt Analysis

Manchester United are notoriously a debt-ridden club, however due to being one of the biggest clubs in the world this has not been a problem and continues that way for now.
Despite the amount of debt held within the club, the cash position of the club is very healthy. This is despite cash reserves falling from £290.3m to £243.0m (16.6%) as the club saw a huge transfer fee outlay and a loss for the year overall. This combined with £13.3m of capital expenditure on the stadium, a divided to shareholders of £22m and £18.9m of repaid debt saw cash fall significantly. The club still have more than enough cash for the day to day running of the club.
Debt also fell slightly, decreasing from £503.3m to £495.8m (-1.5%) as the club paid down debt of £18.9m. The majority Manchester United’s debt is long term, with only £9.1m due this year. The debt is all external debt meaning the interest rate is higher than owner debt and averages at around 3-4% a year which adds considerable cash burden to the club that their less indebted rivals do not experience.
This means Manchester net debt rose significantly, increasing from £213.0m to £253.8m (19.2%) due to the decrease in cash reserves. As mentioned this isn’t a major cause of concern for Manchester United given their stature, however as clubs begin towards an era of sustainability, this isn’t something Manchester United can currently achieve. As time goes on Manchester United may lose some financial competitiveness and miss out on key signings due to financial constraints due to their high debt levels, something we may be already beginning to see.
Thanks for reading, share with a Manchester United fan!